
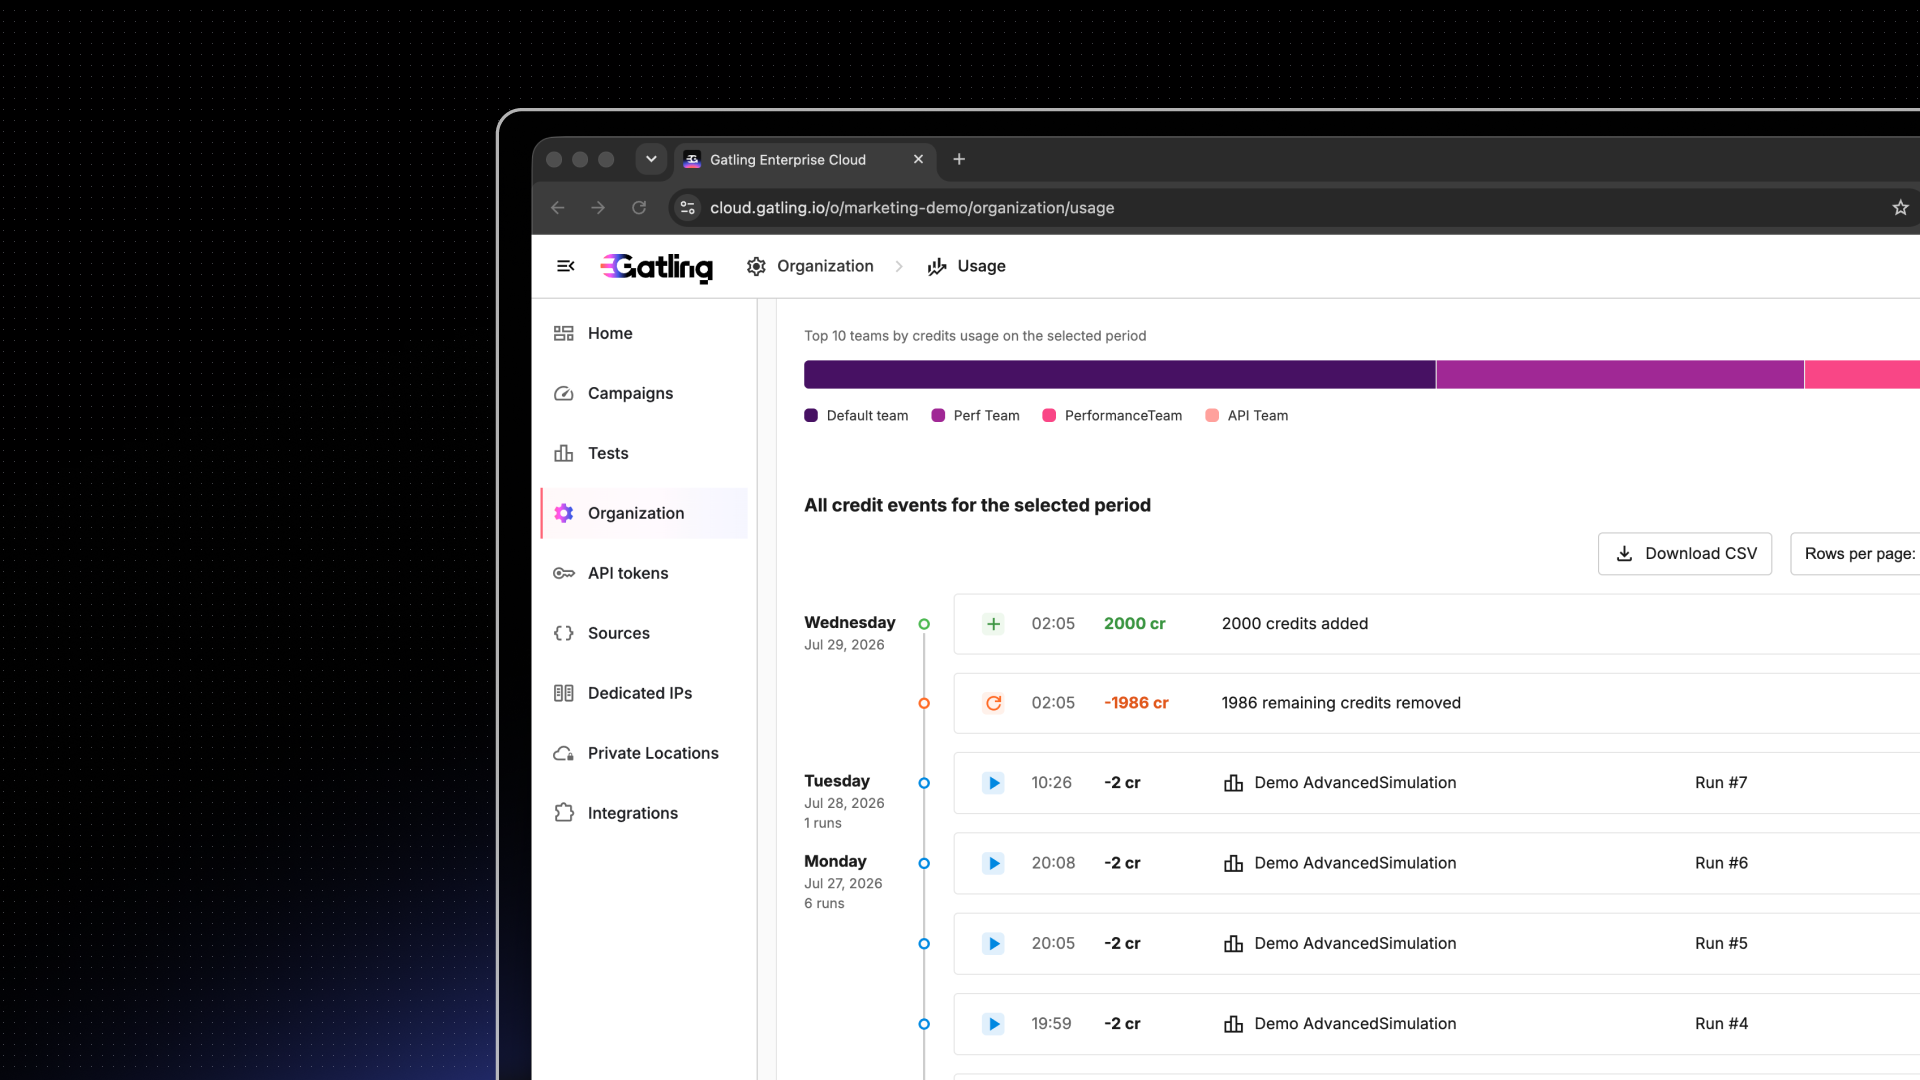
Usage Dashboard just got more granular. You have now more ways to slice your consumption data and understand where it's going.
What's new in this release:
Credits / Runs / Minutes switch
Toggle between three units directly on the dashboard, so you can read your usage in whichever metric matters most for a given conversation, cost tracking, capacity planning, or raw activity.
Group by Test / by Team switch
Pivot the same data by test or by team, without needing two separate views. Useful whether you're auditing a specific test's footprint or comparing consumption across teams.
Top 10 (Stacked Bars)
A stacked bar view of your top 10 tests or teams by consumption, so the biggest contributors to your usage are visible at a glance, not buried in a table.
Credit Events Table
The detailed, event-by-event table of credit consumption gives you the granular audit trail behind the aggregated numbers above.
Available now in Gatling Enterprise Edition.
Related updates
Your all-in-one load testing platform
Design complex tests, manage global infrastructure, and turn results into action on one powerful platform.
Need technical references and tutorials?
Minimal features, for local use only
