OBSERVABILITY + LOAD TESTING
360° Observability
needs more than signals
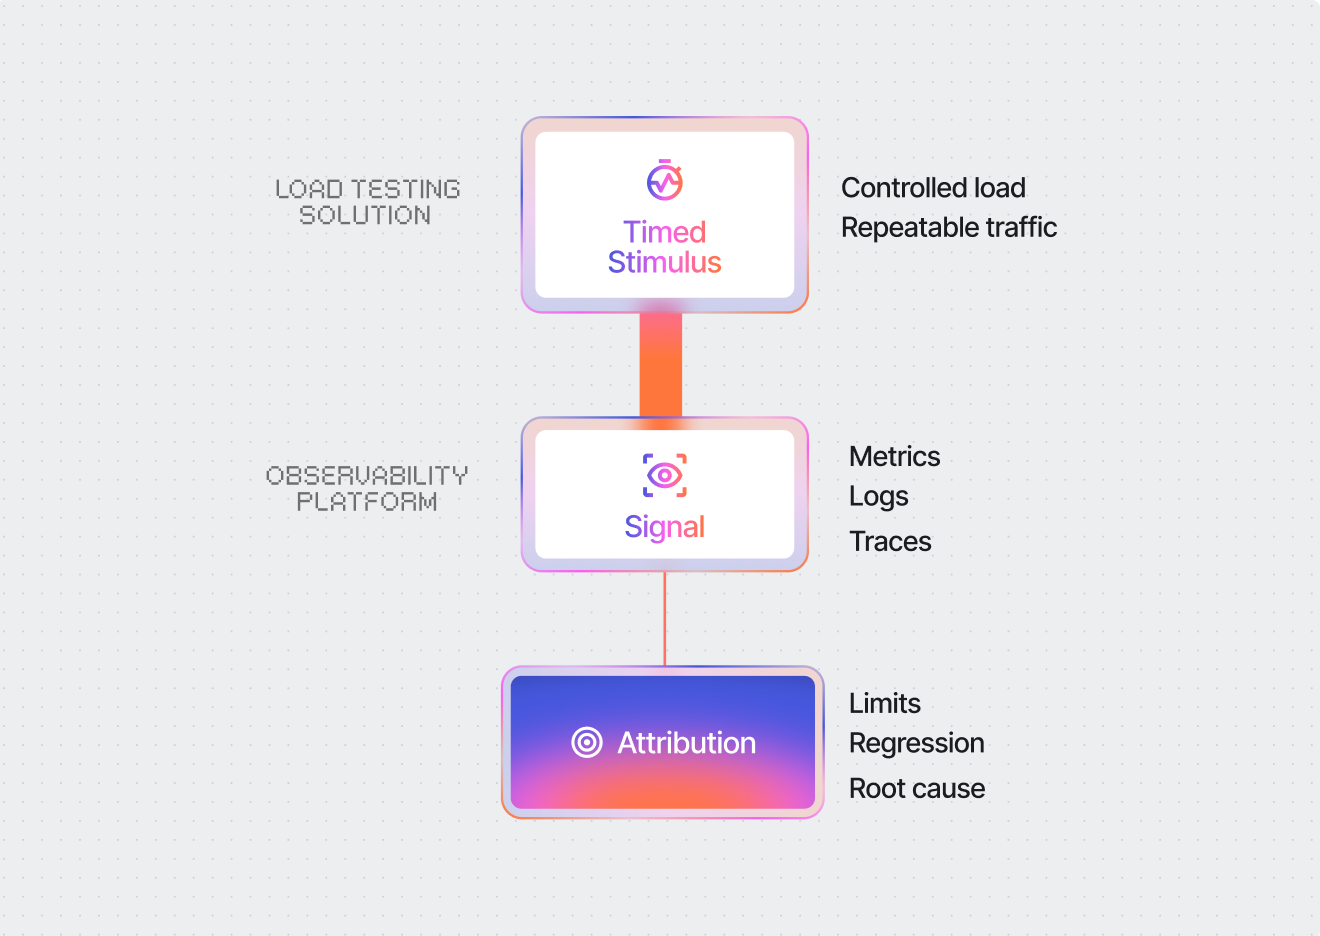
Observability shows how your systems behave in production.Load testing adds the missing piece: controlled, repeatable load that turns telemetry into insight.
Metrics, logs, and traces explain what happened. Load testing explains why it happened, and what will happen next.


Signals are necessary. Stimulus makes them usable.
Observability captures production truth, but production is noisy. When performance degrades, teams still can’t answer the questions that prevent incidents:
What exact workload triggers p99 inflation?
Which layer saturates first: edge, gateway, service, dependency?
Is this a regression or production variance?
Can we reproduce the failure mode on demand?

Load testing alone shows symptoms like slow response times, but not where time is actually spent. Observability alone shows production behavior, but doesn’t reproduce failure conditions on demand. When you correlate both, you can trace performance across every layer under controlled load. That’s what makes results actionable.
Mateusz Piasta
Inpost
CORRELATION UNDER LOAD
What load testing unlocks inside your observability strategy
Controlled load turns observability from monitoring into diagnosis.


Reproducible performance investigations
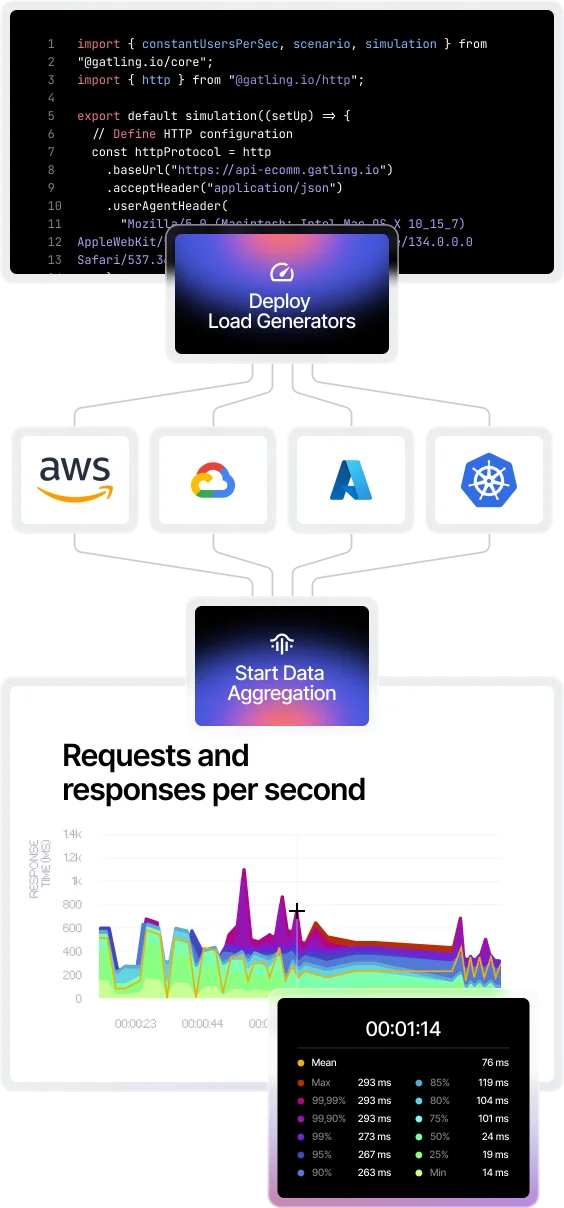
Turn incidents into experiments: replay the same workload and make telemetry comparable across runs, environments, and releases.
Measured system limits, not assumptions
Quantify where saturation begins: latency percentiles diverge, errors cliff, queueing starts, scaling stalls.
Continuous regression signals
Track performance drift across builds using controlled baselines, so regressions become measurable and attributable, not “we think it got slower.”
Bottleneck attribution across layers
Share a Pinpoint where the system breaks first. Correlate percentile inflation with infra KPIs + traces to isolate the limiting layer quickly. source of truth across Dev, QA, and Ops
Observability-driven performance engineering use cases
When teams test high-impact workflows, integrating load testing into observability lets them reproduce issues, isolate bottlenecks, and validate system limits with real telemetry.
Edge and ingress saturation analysis
Validate load balancers, API gateways, ingress controllers, WAF/CDN limits under concurrency. Detect queueing, dropped connections, TLS handshake inflation, and connection exhaustion, even when APM looks “healthy.”
Tail latency amplification (p99 / p99.9) under stress
Expose where tail latency explodes: GC pauses, thread pool starvation, lock contention, downstream timeouts, retry storms. Correlate percentile inflation with infra metrics and trace spans to isolate the limiting layer.
Regression detection across releases
Run identical workloads per build and track deltas as a continuous observability signal. Compare percentiles, errors, throughput, and resource profiles across versions to catch performance drift before production.
Dependency bottleneck isolation
Stress critical paths and correlate slowdowns with distributed traces. Identify which dependency drives latency inflation (database, cache, third-party APIs) and where time is lost under contention.
Capacity planning with scaling validation
Ramp traffic while monitoring autoscaling behavior, saturation metrics, queue depth, and throughput ceilings. Quantify headroom, safe operating range, and non-linear scaling zones, with evidence in your monitoring dashboard.
SLO verification under controlled traffic mixes
Prove that latency and error budgets hold under realistic peak patterns before release. Validate thresholds against sustained load and baseline comparisons, not production guesswork.
REPLAY
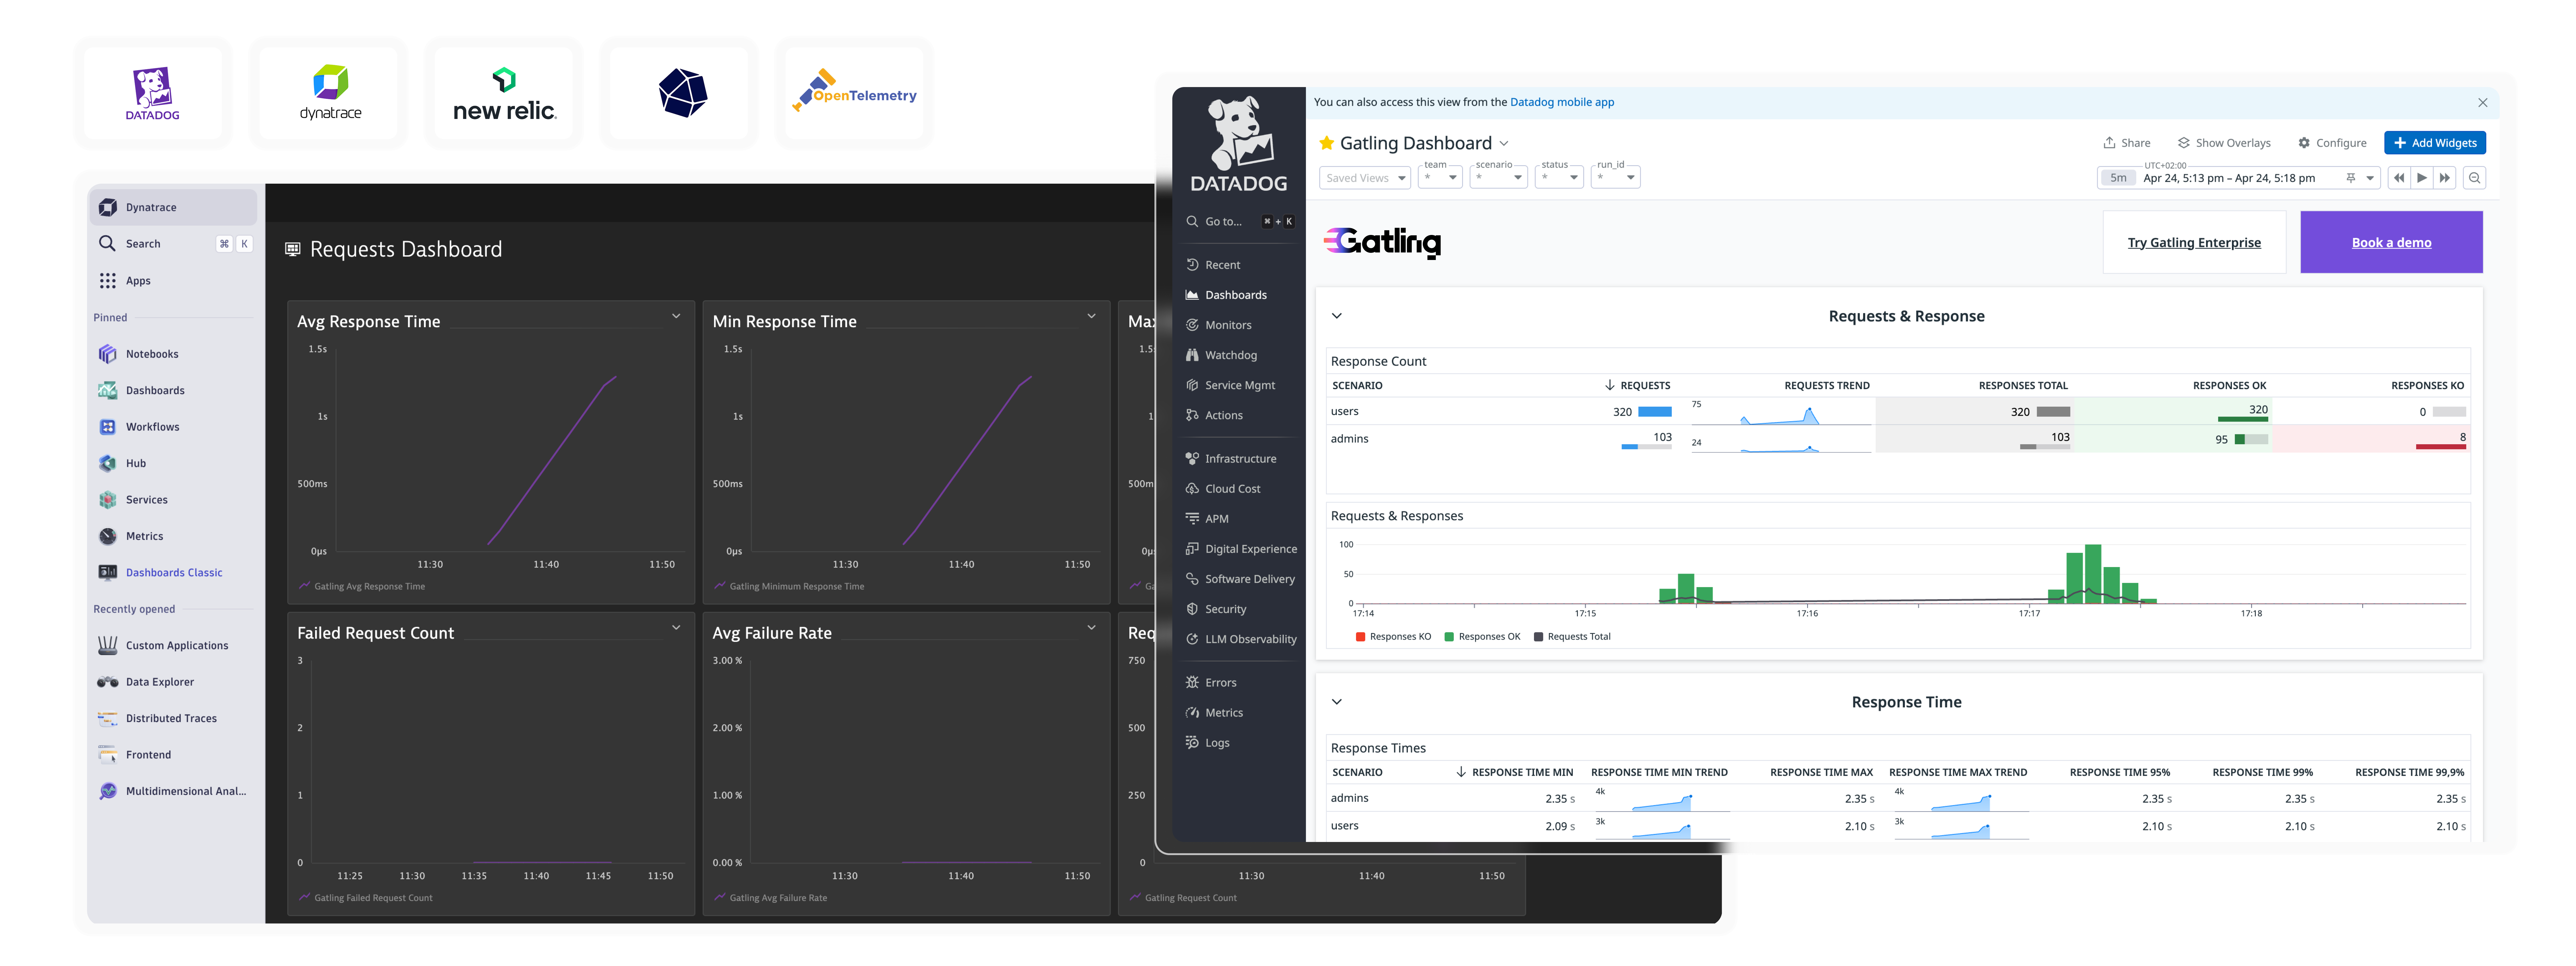
Bring Gatling Results to Datadog
Learn how to run real-world load tests and explore
how to surface metrics in Datadog for instant visibility.

INSTALLATION GUIDES
Getting started with our observability integrations
FAQ
Frequently Asked Questions (FAQs) about observability in performance testing
Observability testing combines load testing with telemetry to understand system behavior under controlled conditions. It lets teams correlate performance metrics, traces, and logs with specific workloads to identify bottlenecks, validate capacity limits, and reproduce production issues in pre-production environments.
The four golden signals are latency, traffic, errors, and saturation. Load testing validates these signals under stress: it exposes tail latency inflation, measures traffic thresholds, triggers error conditions, and identifies saturation points across edge, gateway, service, and dependency layers.
Monitoring shows when and what happened in a system error, while observability reveals why and how it happened by providing access to internal state data across logs, metrics, traces, and system behavior under controlled conditions.
Load testing alone shows symptoms like slow response times, but observability tools show where time is actually spent across every layer, making it possible to trace performance issues, reproduce failure conditions on demand, and turn results into actionable fixes.
Ready to unlock enterprise-grade insights?
Start building a performance strategy that scales with your business.
Need technical references and tutorials?
Minimal features, for local use only


