GATLING + OPENTELEMETRY
Stream load test metrics into your OpenTelemetry pipeline
OpenTelemetry standardizes how metrics, logs, and traces are collected across your systems. Gatling adds the missing piece: controlled, repeatable load that turns telemetry into something you can reproduce, explain, and act on.
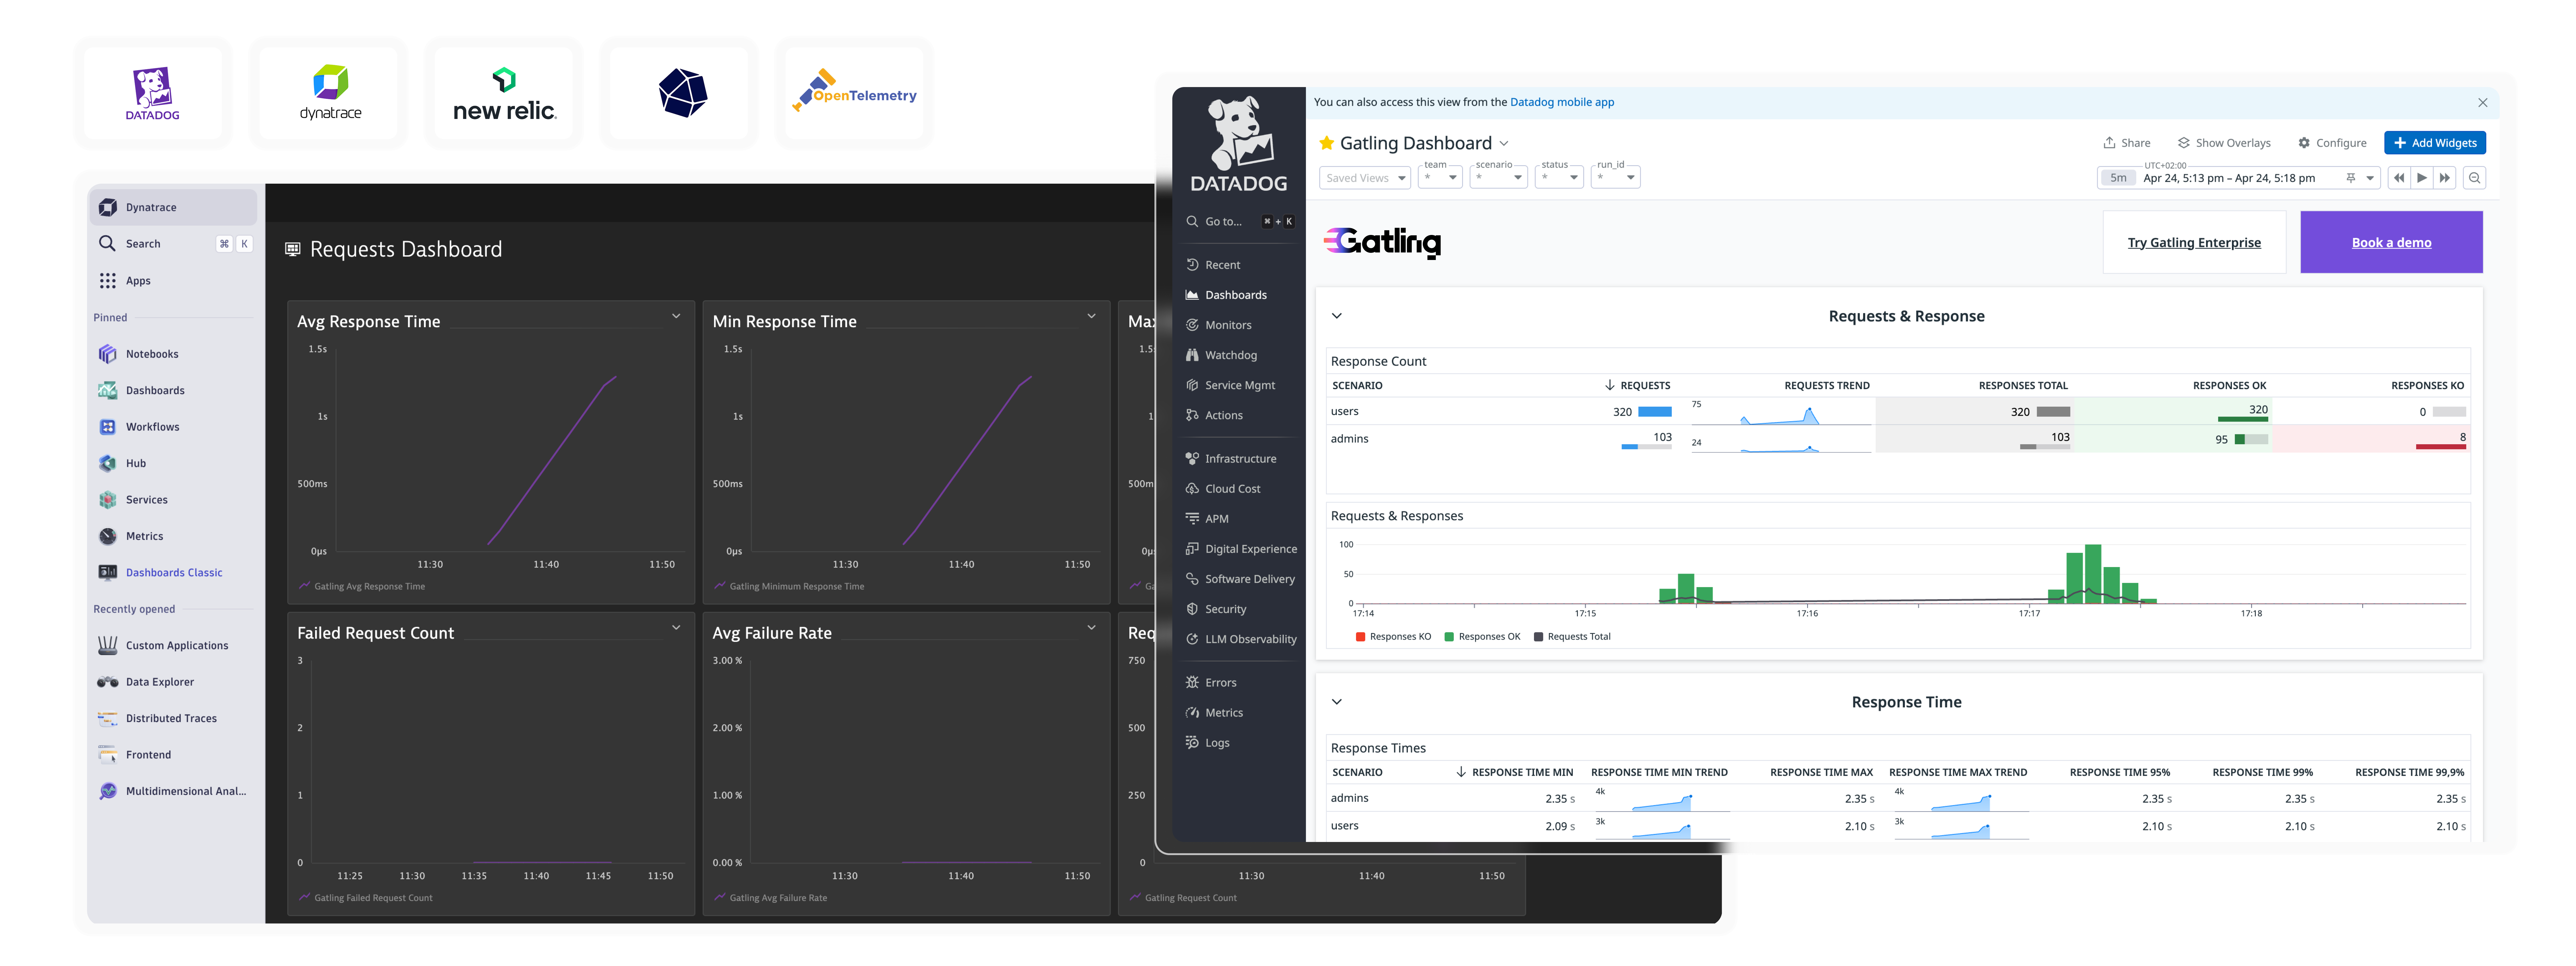
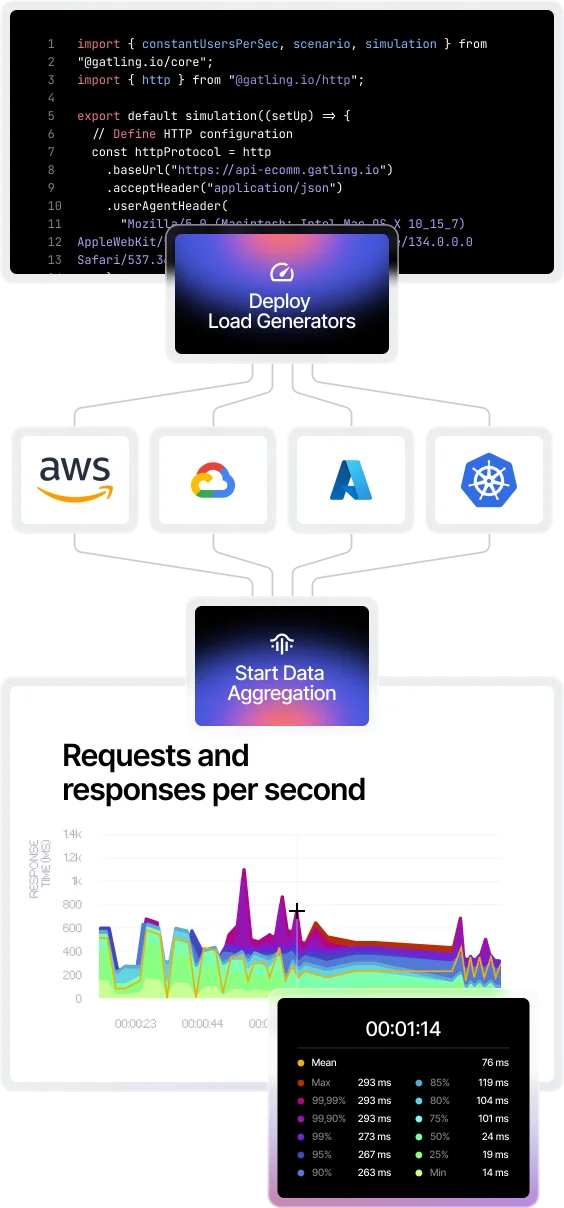
With Gatling and OpenTelemetry, teams investigate p95/p99 spikes, error cliffs, and saturation events directly inside your observability dashboards — using the same workflows they already rely on for production.


Why combine load testing and OpenTelemetry?
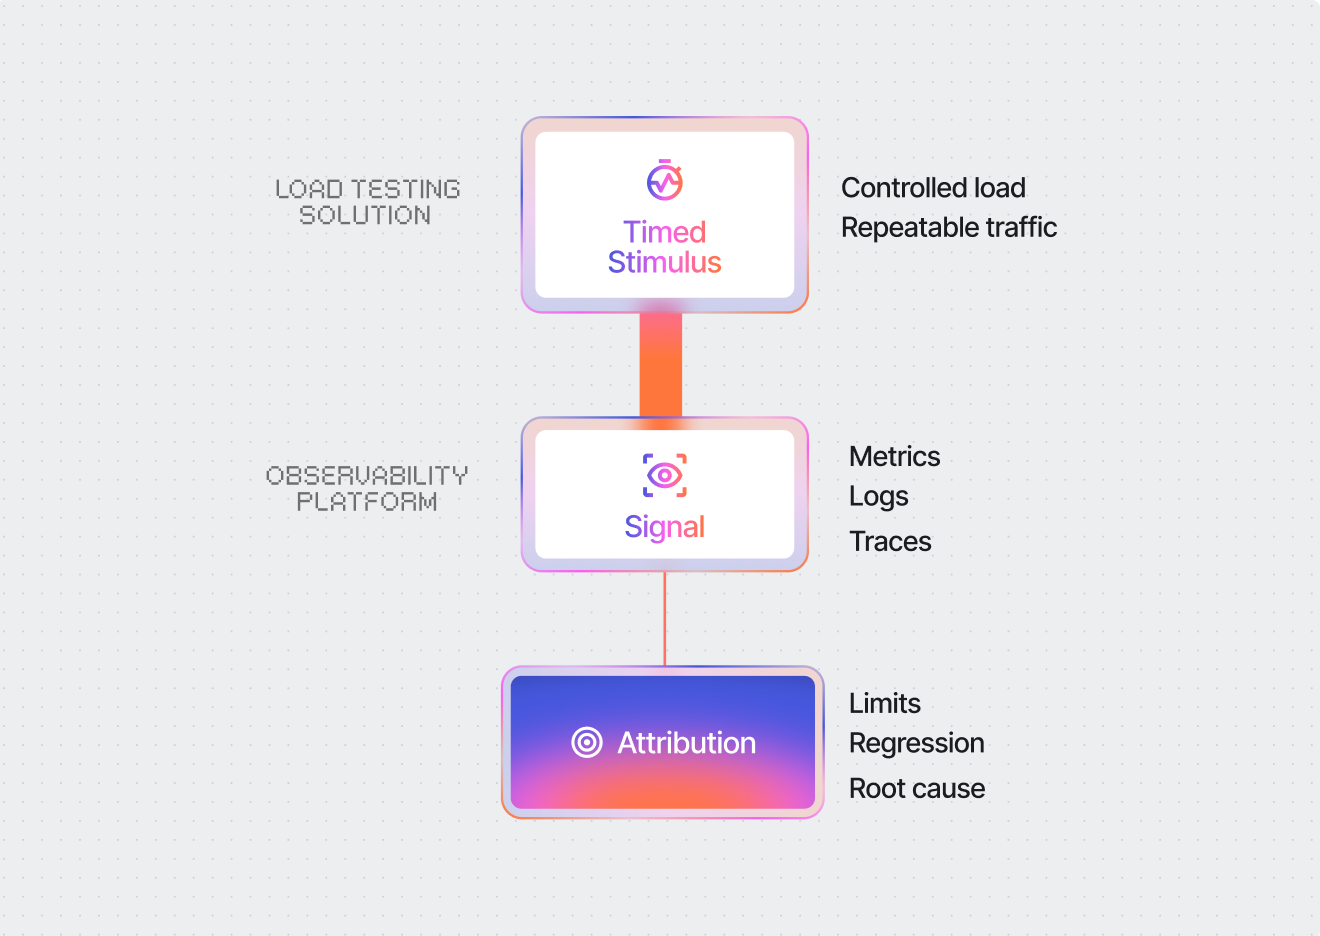
OpenTelemetry provides a unified view of production telemetry, but production traffic is noisy, unpredictable, and impossible to replay exactly.Gatling introduces timed stimulus: the ability to apply a known workload and observe precisely how the system behaves across services, infrastructure, and dependencies.
Combining Gatling with OpenTelemetry lets teams:
reproduce p99 inflation with controlled concurrency
correlate Gatling percentiles with OpenTelemetry traces and infra KPIs
isolate bottlenecks across edge, gateway, services, and dependencies
validate regressions across releases using repeatable traffic profiles

Load testing alone shows symptoms like slow response times, but not where time is actually spent. Observability alone shows production behavior, but doesn’t reproduce failure conditions on demand. When you correlate both, you can trace performance across every layer under controlled load. That’s what makes results actionable.
Mateusz Piasta
Inpost
CORRELATION UNDER LOAD
What Gatling unlocks inside your OpenTelemetry stack
Controlled load turns observability from monitoring into diagnosis.


Reproducible performance investigations
Replay workloads and compare InfluxDB telemetry across runs.
Measured system limits, not assumptions
Quantify saturation thresholds visible in metrics, logs, and traces.
Continuous regression signals
Track performance drift across builds using identical traffic profiles as a continuous signal.
Bottleneck attribution across layers
Correlate p99 spikes with traces and infrastructure data to identify the limiting component.
INSTALLATION GUIDES
Getting started with our observability integrations
Ready to unlock enterprise-grade insights?
Start building a performance strategy that scales with your business.
Need technical references and tutorials?
Minimal features, for local use only


