
SESSION
Understanding your load tests results with AI: AI for Analysis
Load test reports are rich and dense. Percentile tables, throughput curves, error breakdowns: the data is all there, but pulling a decision out of it takes expertise and time.
Meanwhile the people who most need the answer, like developers checking for a regression, SREs on call, and managers waiting on a go/no-go, often can't read the report fast enough to act.
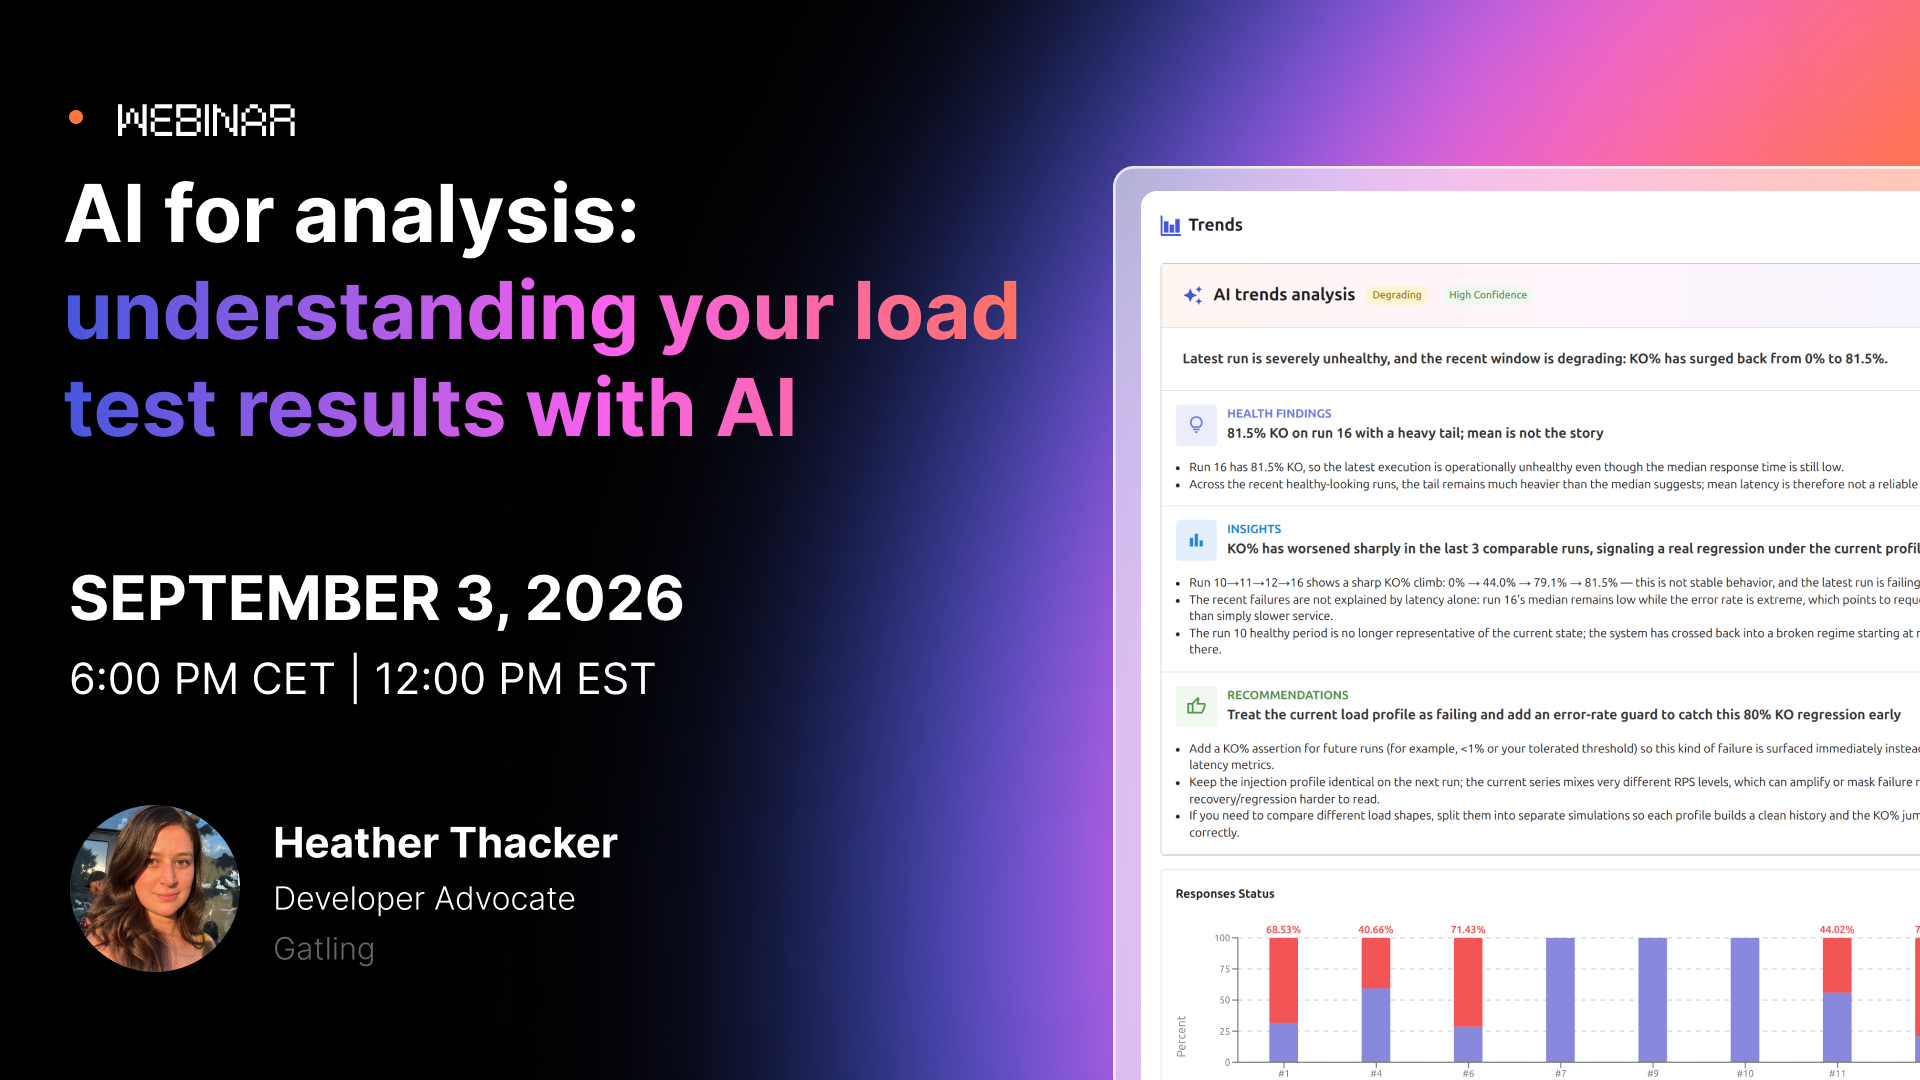
In this session, we'll walk through the three AI analysis features built into Gatling Enterprise: AI Run Summary, AI Trends Analysis, and AI Run Comparison.
Each answers a question you already ask: What happened in this run? Where is this test heading? What changed between runs? And each returns the same clear shape: a health finding, insights, and recommendations, with a verdict and a confidence badge so you know how much to trust it.
We'll see the reports in a demo, on a platform that looks completely healthy: zero errors, fast medians, every assertion green. Watch the AI uncover what the dashboards miss: a hidden latency tail on the checkout path, and an intermittent rate-limit that only appears under load.
What you'll learn:
- The three features and when to use each: Run Summary for one run, Trends Analysis across your last 10, Run Comparison for 2 to 5 runs
- How to read the output: the Health, Insights, and Recommendations structure, plus the verdict and confidence badges
- How AI catches what a green dashboard hides: tail-latency and load-triggered issues that averages and pass/fail gates conceal
- How to turn a report into a decision: endpoint-level findings and the exact fix, in language you can paste into Slack or a ticket
- Best practices for trustworthy results: standardizing load profiles and assertions so the AI reasons with high confidence
Your all-in-one load testing platform
Design complex tests, manage global infrastructure, and turn results into action on one powerful platform.
Need technical references and tutorials?
Minimal features, for local use only
