
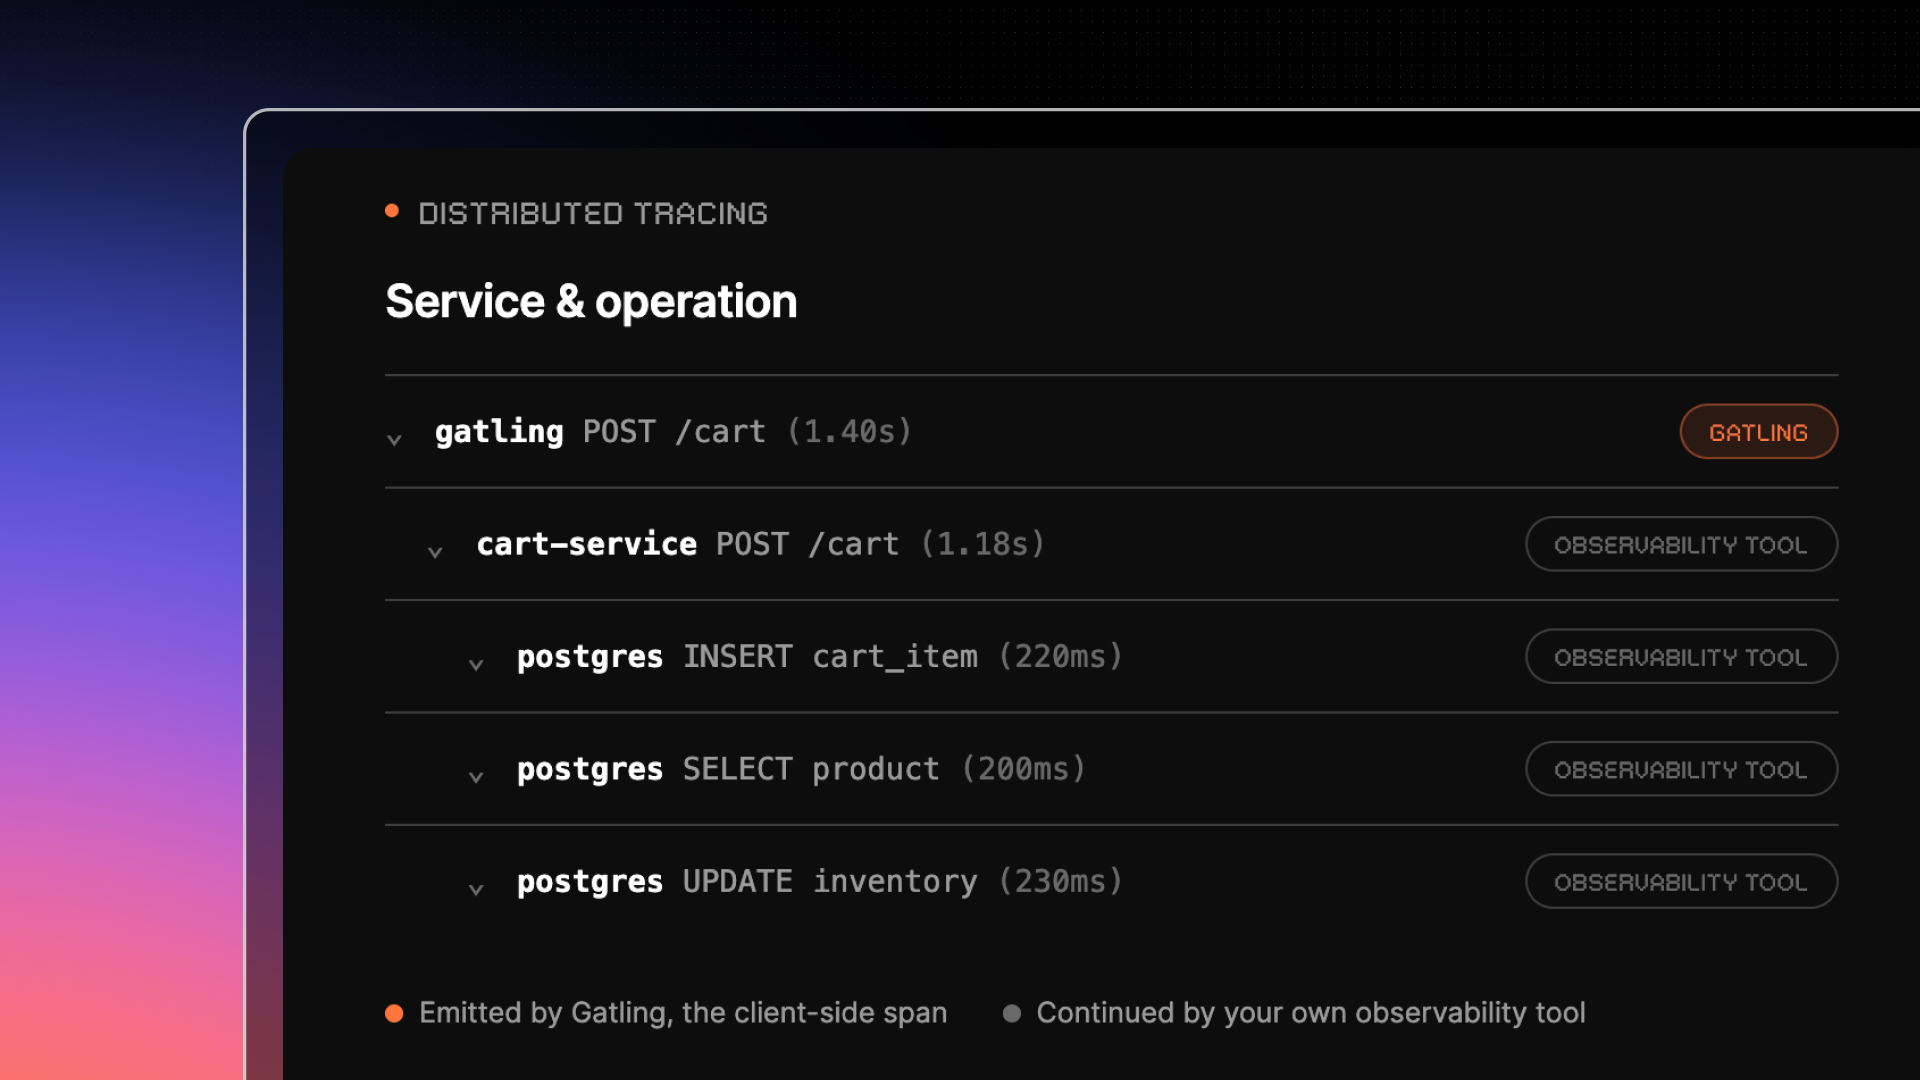
Distributed tracing is now available in Gatling Enterprise Edition. Gatling and your application share a single identifier for the same request, so instead of matching a slow percentile to your own traces by hand, you get the exact request, end to end, in one trace.
Built on OpenTelemetry and the W3C Trace Context standard, so it works with any backend that already accepts OTLP: Datadog, Dynatrace, Dash0, VictoriaMetrics, Tsuga, or your own collector.
How it works
A request is sampled: Gatling picks a fixed number of requests per second to trace, and generates a trace ID for each one.
Trace context goes on the wire: the standard traceparent and tracestate headers are added to the request, alongside whatever your test already sends.
Your application continues the trace: your existing instrumentation reads the incoming headers and attaches its own spans, controllers, database calls, downstream services, to the same trace ID.
Gatling exports its own span: once the response comes back, Gatling reports what it saw client-side: total time from the injector, and sends it to your backend over OTLP.
Both halves meet: in your observability platform, Gatling's span and your application's spans sit under one trace, ready to inspect side by side.
What it adds, and what it doesn't replace
Your existing metrics integrations (Datadog, Dynatrace, New Relic, InfluxDB, OpenTelemetry) still report response times, throughput, and error rates for every request, continuously. That coverage doesn't change.
Distributed tracing covers a small, configurable sample of requests, and goes one level deeper for each of them: instead of an aggregate number, you get the actual path a request took through your system, and the gap between what the client saw and what the server measured, which is network time and queueing that neither side can see alone.
Use metrics to know something degraded. Use tracing to see, for one request, exactly where.
Scope
Distributed tracing currently covers HTTP requests. Sampling is configurable per run, and shared across all load generators so the total exported rate matches what you set, regardless of how many load generators the run uses.
Related updates
Your all-in-one load testing platform
Design complex tests, manage global infrastructure, and turn results into action on one powerful platform.
Need technical references and tutorials?
Minimal features, for local use only
