
Table of contents
Connecting Performance Testing with Observability


Last updated on
Thursday
March
2026
Connecting Performance Testing with Observability
Performance testing tells you how your APIs behave under load. Observability tells you what's happening inside your services. Neither one alone gets you from symptom to cause when troubleshooting.
Together, they form a feedback loop that can take you from a failing test to an automated notification, a distributed trace, and a root cause, without manually checking a dashboard.
Let's go through how to connect Gatling Enterprise Edition with Dynatrace: how the integration works, what data flows between the two tools, and how to build alerting and automated workflows on top of real load test metrics.
Why These Two Disciplines Need Each Other
Performance testing and observability are often practiced independently, which means you end up running a load testPerformance testing and observability are often practiced independently, which means you end up running a load test, spotting elevated p95 response times in your Gatling report, then switching to your monitoring tool to investigate with no shared time axis and no way to query load test data alongside infrastructure metrics.
The integration between Gatling Enterprise and Dynatrace eliminates that disconnect.
Load test metrics (response time percentiles, error rates, throughput, connection counts) stream into Dynatrace in near real-time as custom metrics, sitting alongside your application telemetry.
You can query them, chart them, set thresholds, and trigger automated workflows, so a performance problem detected during testing can automatically notify your team, surface the relevant traces, and point to the responsible backend component while the test is still running.
The Two Sides
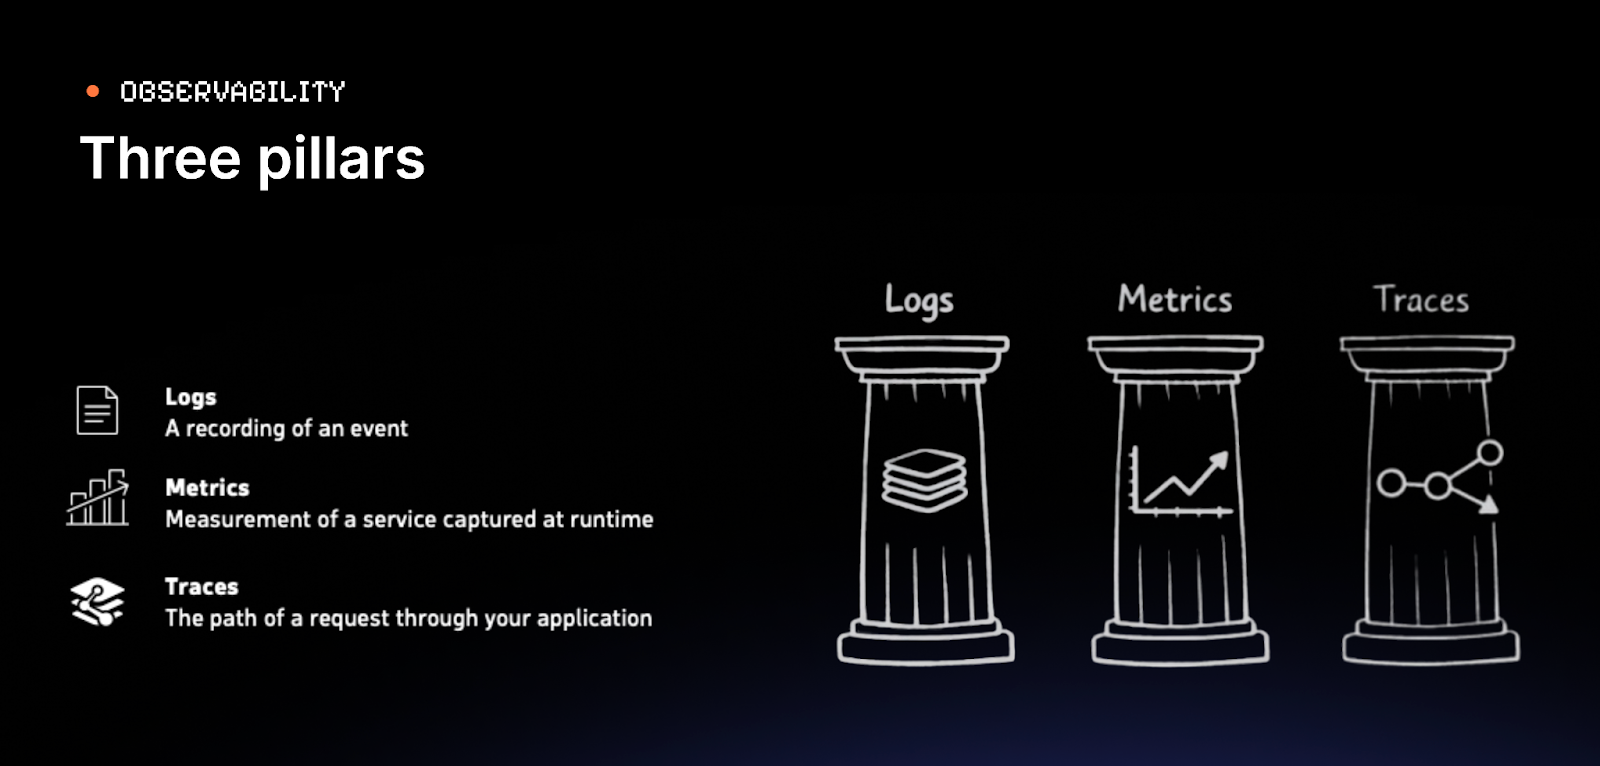
Observability is organized into three data types.
- Logs are timestamped records of discrete events.
- Metrics are numerical measurements aggregated over time, efficient to store and fast to query.
- Traces follow a single request through every service it touches, recording the duration and outcome of each hop.
Of the three, metrics are the primary channel through which Gatling Enterprise Edition sends data to Dynatrace, but traces are what you reach for during investigation.
Performance testing answers a deceptively simple question: does your system work when many people use it at the same time?
The Metrics That Matter Most
Every team in your engineering organization has a stake in these numbers. SREs use them to define and defend SLOs. SREs use them to define and defend SLOs. Platform engineers need them to validate infrastructure changes under realistic conditions. QA teams use them to catch regressions before release. Developers need the feedback to understand how their code behaves at scale, not just in isolation. And ops teams need early warning before something hits production at 2 AM.
- Response time percentiles: If your p95 is 400ms but your p99 is 12 seconds, that p99 represents real users having a terrible experience. Percentiles reveal what the average hides.
- Error rates: Errors that don't appear with one user frequently appear at 100 users.
- Throughput: Requests per second, and whether it scales linearly with virtual users or plateaus.
- Connection behavior: Are connections being reused or is every request opening a new one? Connection leaks under load are nearly invisible until they bring a system down.
Structuring a Gatling Simulation
Gatling tests can be broken down into three parts: the scenario (what a virtual user does), injection profile (how users are introduced over time), and assertions (pass/fail criteria).
Scenarios
These are typically structured around complete user journeys using groups, for example, sections like authenticate, addToCart, buy, which appear as distinct sections in Gatling's reports.
Injection profiles
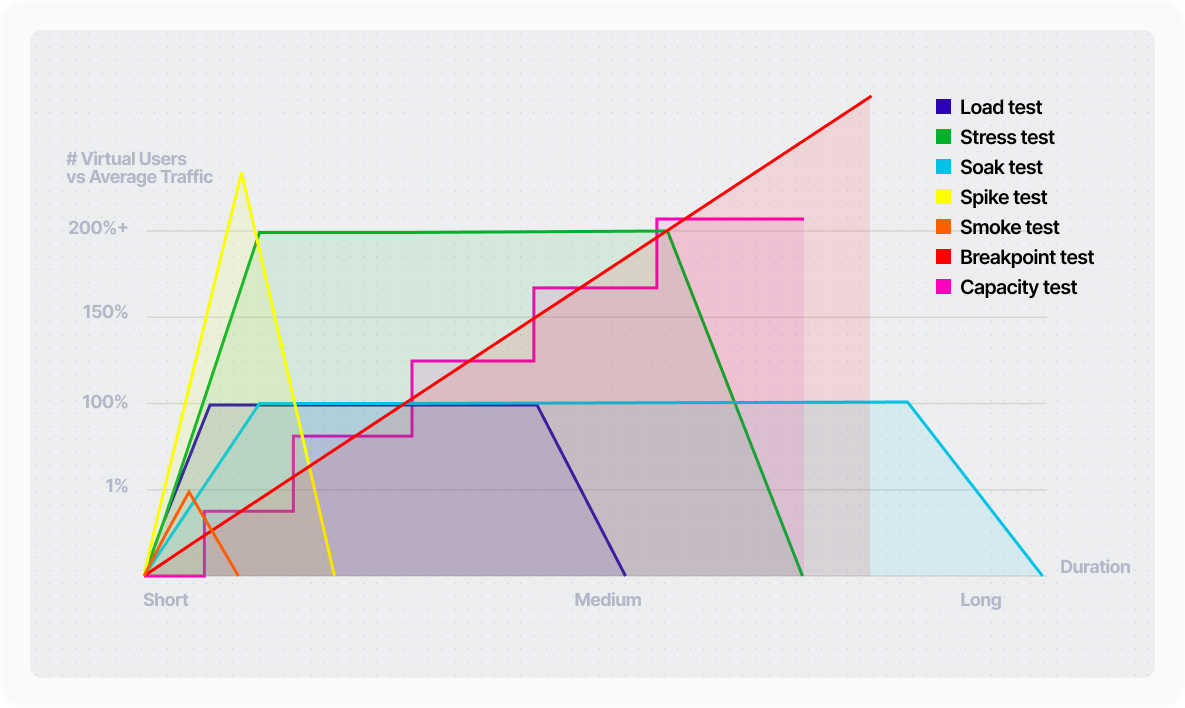
This determines the test type: smoke, soak, stress, capacity, breakpoint, or some combination of those test type characteristics. A well-structured simulation parameterizes this so the same codebase supports any test type without modification.
Assertions turn data collection into a signal:
const assertions = [
global().responseTime().percentile(90.0).lt(500),
global().failedRequests().percent().lt(5.0)
];
If either condition is violated, the test fails, and that failure is visible in reports, your CI/CD pipeline, and with the Dynatrace integration you can trigger downstream alerting automatically.
Connecting Gatling Enterprise to Dynatrace
The integration is configured in Gatling Enterprise's control plane. You provide your Dynatrace environment URL and an API token with Ingest metrics and Ingest events permissions. Every subsequent test run sends data automatically.
Gatling Enterprise pushes custom metrics under the gatling_enterprise prefix, with over 30 metric keys covering response time percentiles, response codes, concurrent users, TCP connection counts, TLS handshake times, and bandwidth.
It also sends events marking the start and end of each test run, giving you time-window anchors for correlating load with infrastructure behavior.
Building the Dynatrace Side
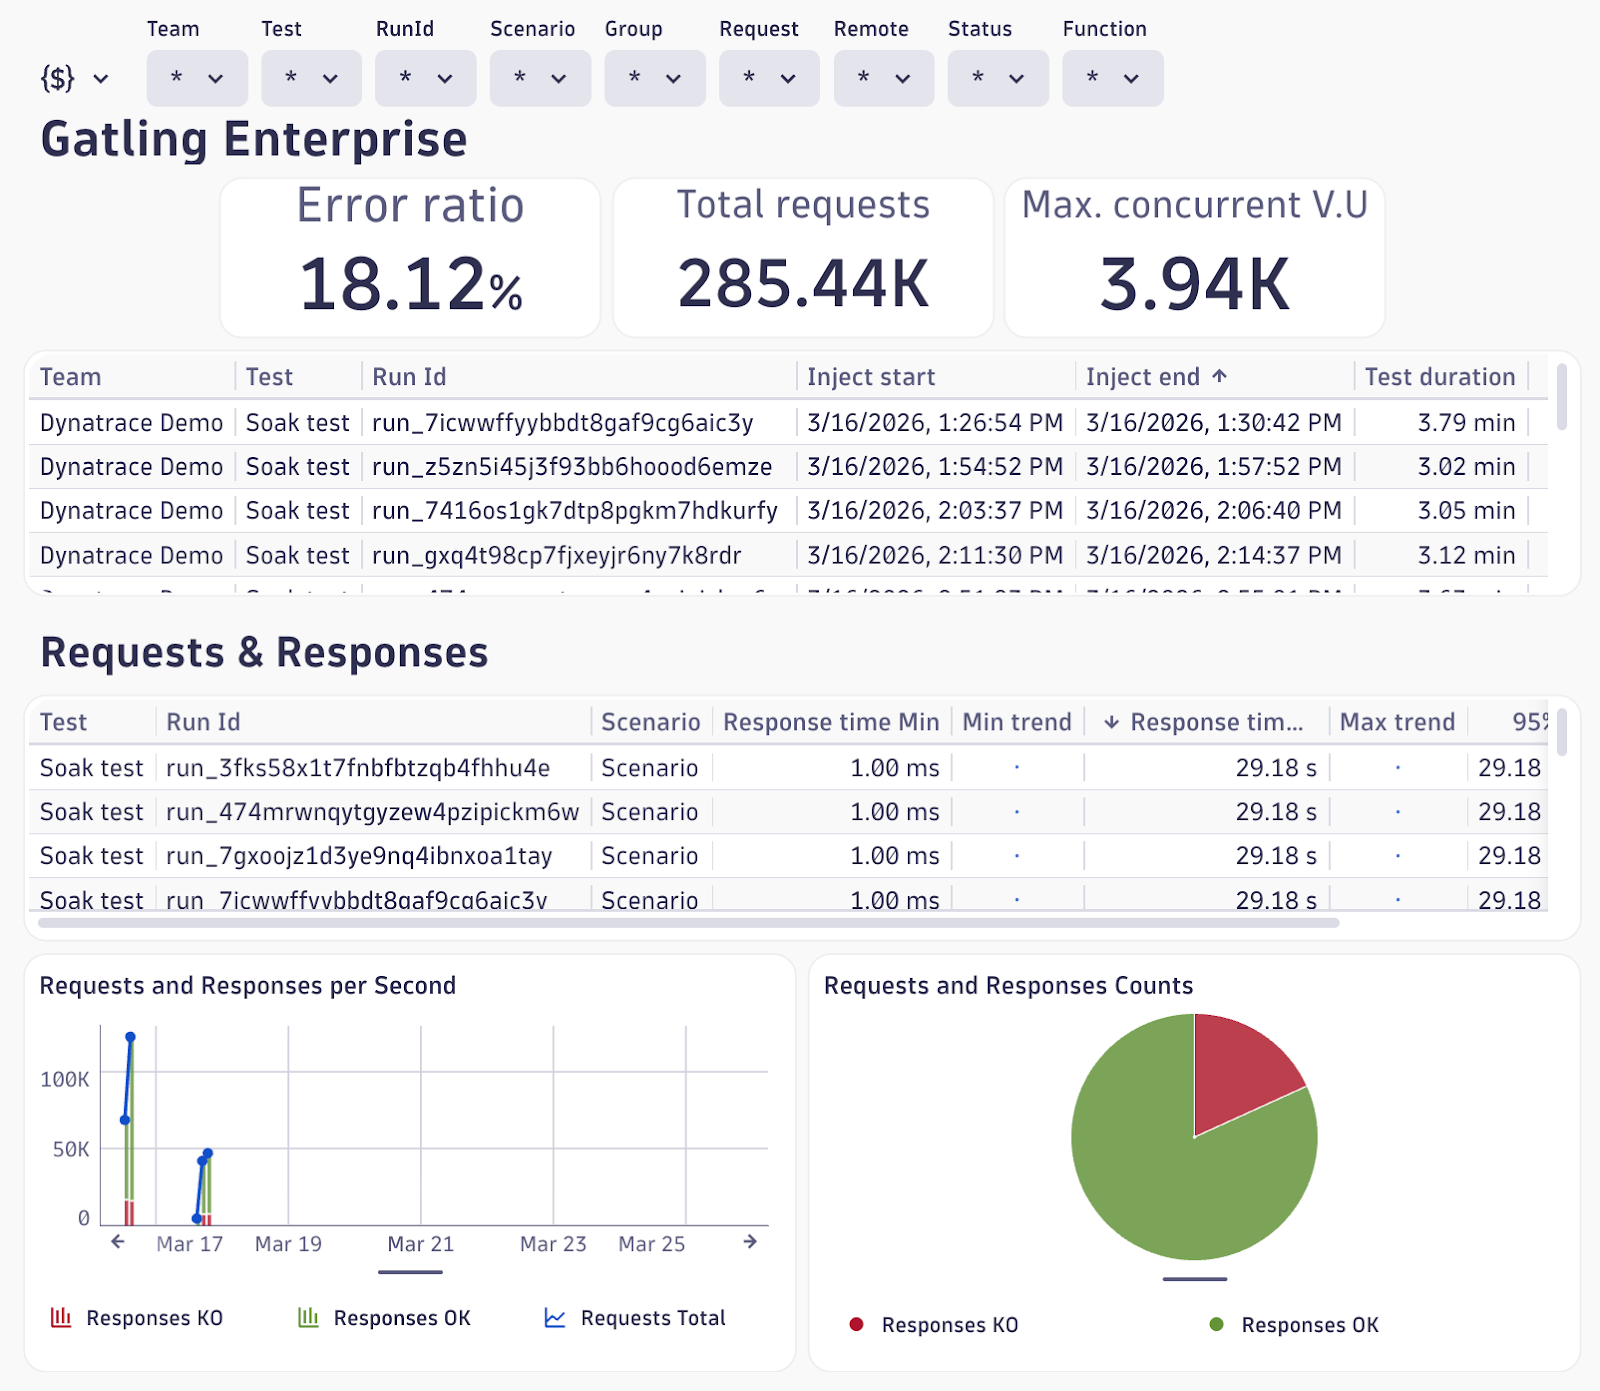
Dashboards
Surface Gatling metrics alongside infrastructure data in a single view: p95 response times, concurrent users, error rates next to Lambda duration, API Gateway latency, and database throughput.
When Gatling shows a response time spike, you immediately see whether infrastructure metrics shifted at the same time.
Alerts
Configure metric event rules that fire while a test is running. Useful starting points:
- p95 response time exceeding a ceiling (e.g., 5,000ms)
- 500 response code count exceeding a threshold
- Connection leak detection - TCP close count falling significantly below open count
- Sustained high p99 latency using Dynatrace's auto-adaptive threshold model, which learns the baseline and alerts on anomalous deviation rather than a static number
Each alert has configurable sensitivity: violating sample count, sliding window size, and de-alerting thresholds.
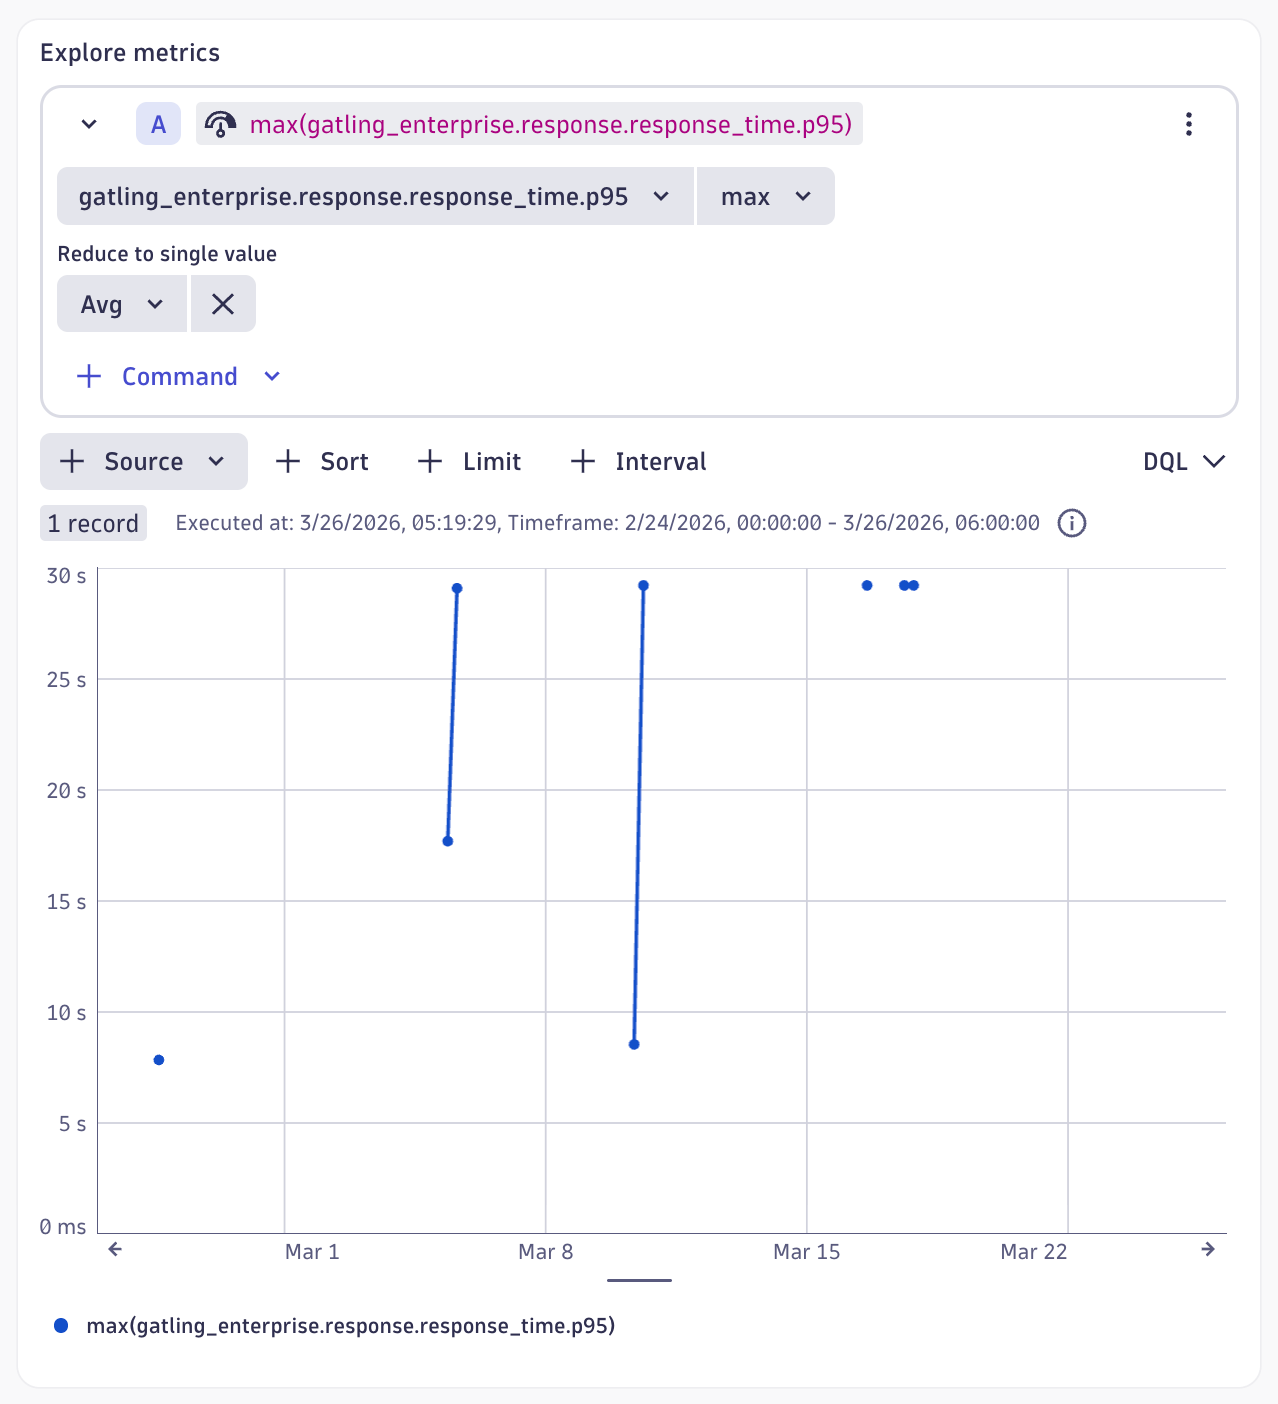
Notebooks
Before formalizing an alert, explore your data interactively. Write DQL queries, visualize results from recent test runs, and choose thresholds that reflect real breaches rather than normal variation.
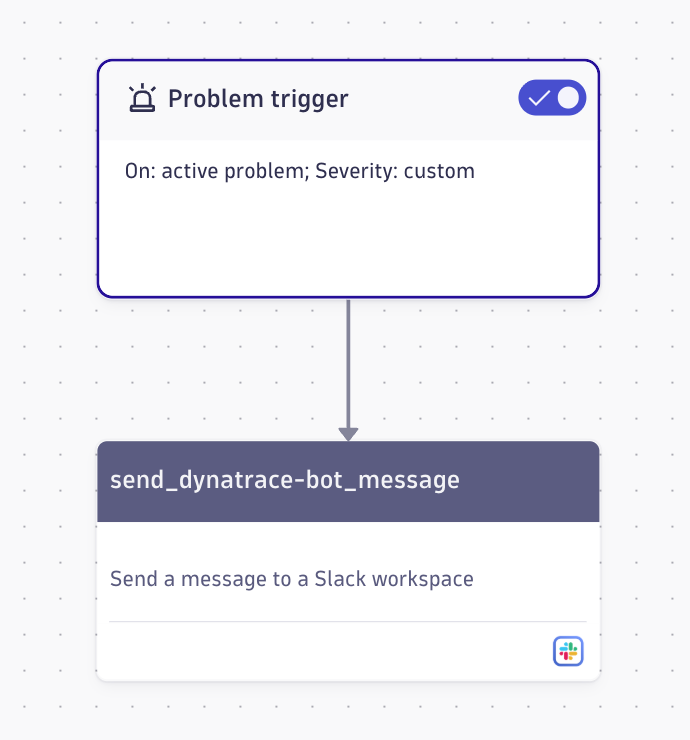
Workflows
An alert alone doesn't complete the loop. Dynatrace Workflows trigger actions when an alert fires — the simplest being a Slack notification with alert details and a link to the problem. Workflows also support GitHub, Jira, custom HTTP requests, and as AI tooling matures, automated remediation.
Investigating Failures with Distributed Tracing
When an alert fires, the Slack notification gets you into the tool. Distributed tracing gets you to the root cause.
Dynatrace captures traces across your service topology automatically. When a Gatling test generates failures, those failures produce traces.
For a test producing six-second response times, the trace shows exactly where those seconds were spent.
If database queries that normally execute in milliseconds aren't reached until second six, the trace makes the server-side delay unambiguous.
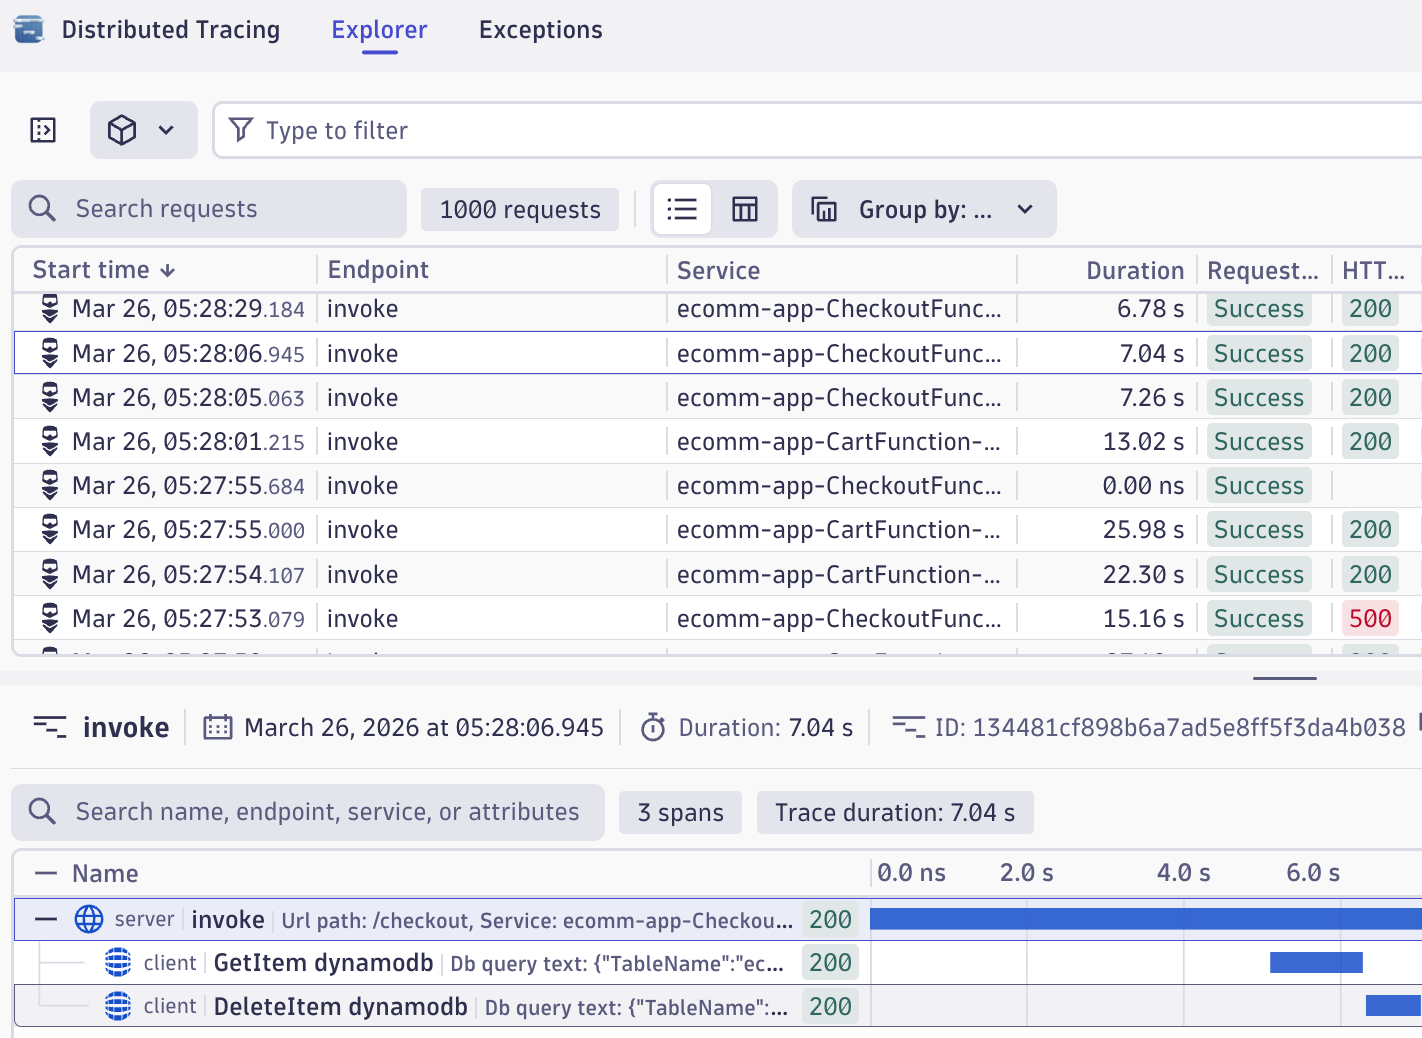
This is what makes the integration more than a dashboard convenience. Gatling identifies that a threshold was breached. Dynatrace explains why.
The Full Pipeline
- A Gatling simulation is committed and deployed to Gatling Enterprise via GitHub Actions
- The run workflow calls the Gatling Enterprise API to start the test
- Metrics stream to Dynatrace in near real-time
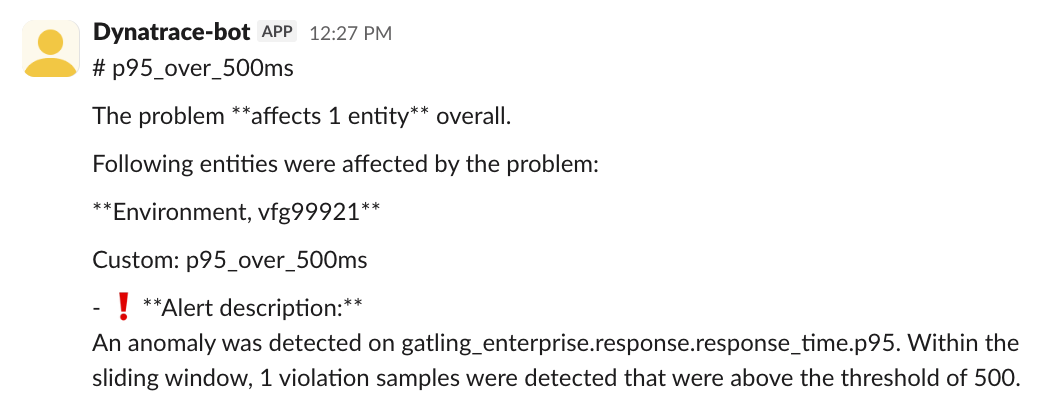
- A metric crosses a threshold and the anomaly detection rule fires a problem event
- A Dynatrace workflow sends a Slack message with alert details
- The engineer opens the problem, navigates to traces, identifies the responsible component
- The fix is deployed, the simulation re-run. Clean metrics, no alert, assertions pass
No step in this pipeline requires manually polling a dashboard. The test generates the signal; the integration routes it.
Bringing It All Together
You'll need:
- Gatling Enterprise: the integration is available in this edition
- Dynatrace environment: a free trial or the Dynatrace playground work as starting points
- Dynatrace API token with
metrics.ingestandevents.ingestpermissions
The Gatling documentation covers the integration configuration, including all metric keys and dimensions. The demo code referenced throughout this post is available on GitHub.
If you want to watch the session's replay, find it here: Connecting observability with performance testing
When a failing test automatically produces a notification, a trace, and a root cause, instead of a result someone has to go find, then the gap between detecting a problem and understanding it collapses to minutes.
{{card}}
FAQ
FAQ
Is Dynatrace an observability tool?
Dynatrace is an observability platform that combines logs, metrics, and distributed traces with AI-powered analytics and automation to detect, diagnose, and resolve performance problems across your application stack.
What are the 4 golden signals for observability?
The four golden signals are latency (response time), traffic (request volume), errors (failure rate), and saturation (resource utilization) — the core metrics that reveal system health and performance under load.
What metrics does Gatling Enterprise send to Dynatrace?
Gatling Enterprise streams over 30 custom metrics to Dynatrace including response time percentiles (p50, p95, p99), error rates, throughput, concurrent users, TCP connection counts, TLS handshake times, and bandwidth measurements in near real-time during test execution.
Related articles


Ready to move beyond local tests?
Start building a performance strategy that scales with your business.
Need technical references and tutorials?
Minimal features, for local use only
