
LIVE SESSION
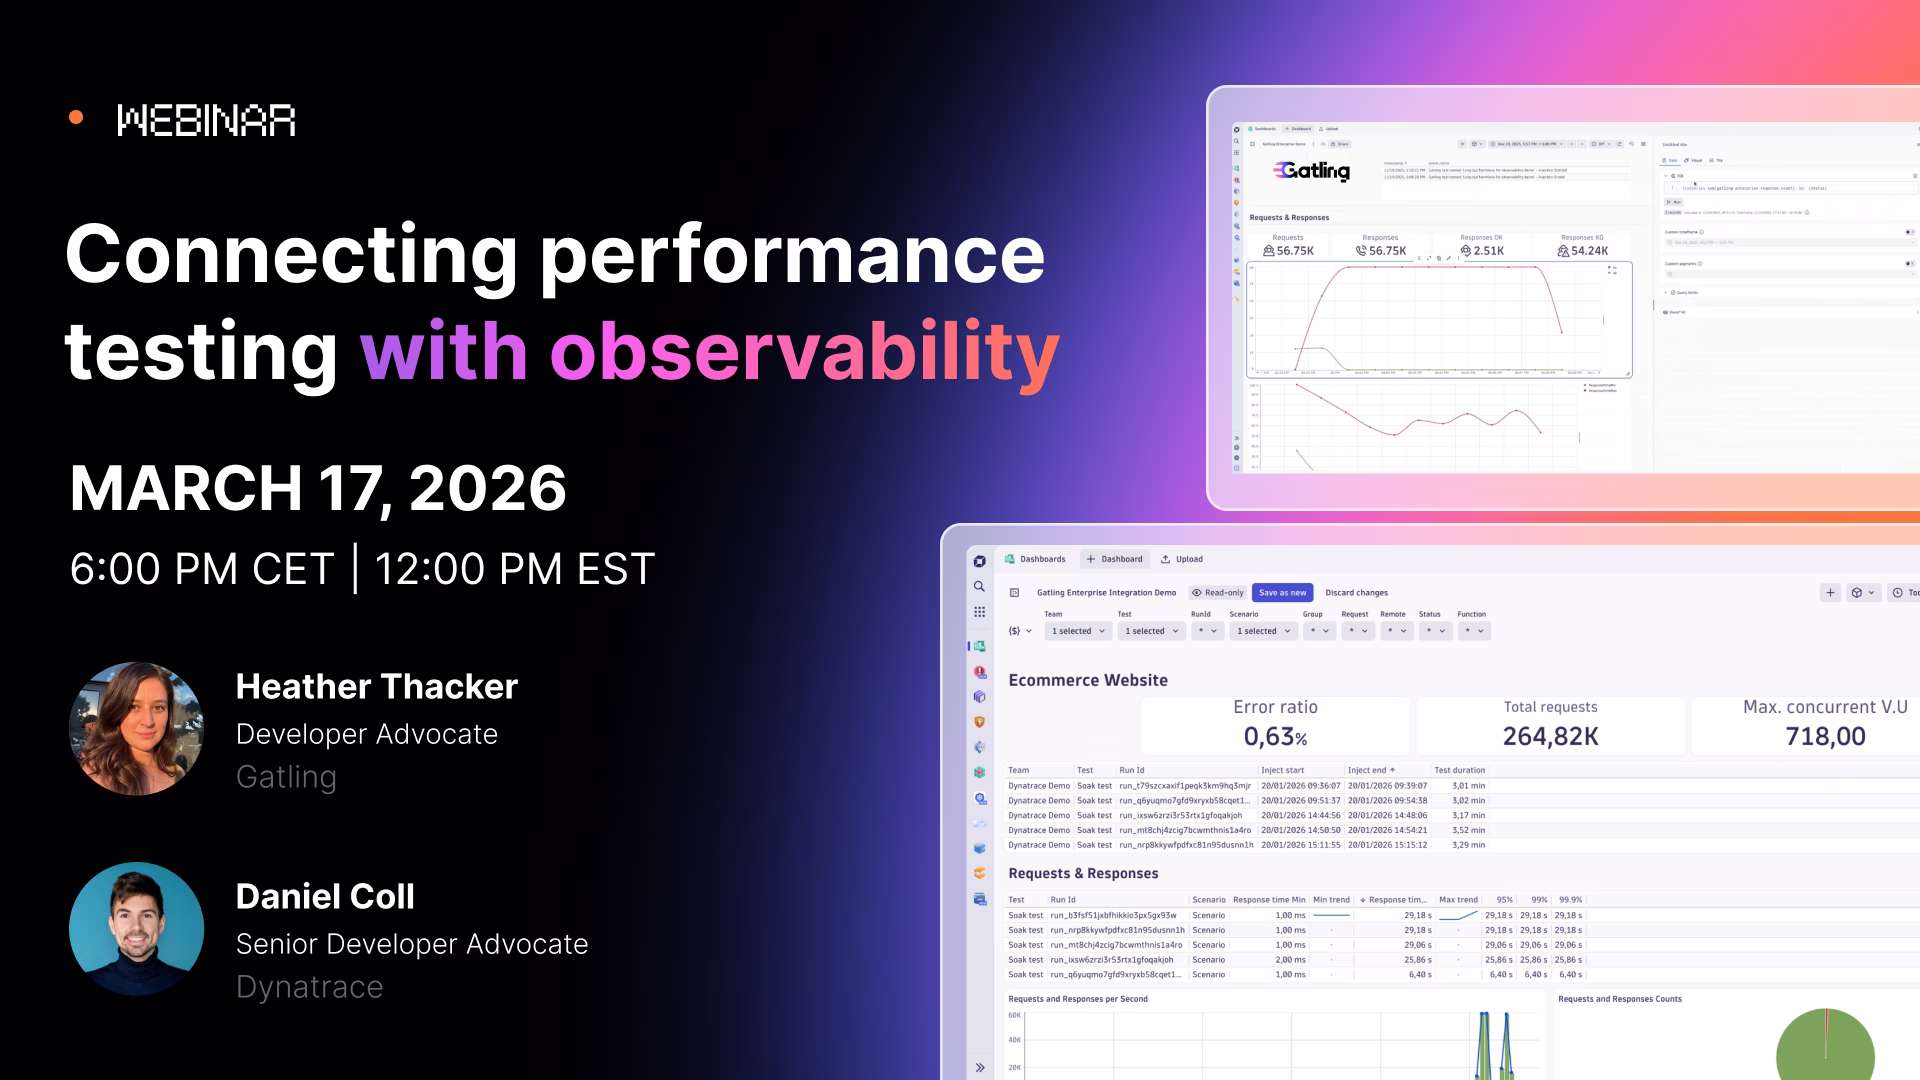
Connecting performance testing with observability
Performance testing tells you how your APIs behave under load. Observability tells you what's happening inside your services. But when these live in separate tools, you're left jumping between dashboards trying to piece together the full picture.
In this joint webinar with Dynatrace, we'll walk through how to integrate Gatling Enterprise Edition with Dynatrace by connecting your load test metrics directly to server-side traces, logs, and automated alerting workflows. You'll see how to go from a failed test to a Slack notification without manual intervention.
You'll learn:
- How performance testing metrics (response times, error rates, connection counts) relate to server-side observability (traces, logs, metrics)
- How to set up alerts based on Gatling test data, like p95 latency thresholds, 500 errors, or connection leaks
- How Dynatrace anomaly detection can trigger automated workflows during a test run
- A live demo: triggering alerts, kicking off workflows, and sending notifications to Slack
This is for you if:
- You want to connect your load testing results to your observability platform
- You're interested in automating responses to performance issues caught during testing
- You're evaluating how Gatling and Dynatrace can work together in your stack
Speakers:
Dani Coll, Senior Developer Advocate, Dynatrace
Heather Thacker, Developer Advocate, Gatling
Date + Time: 6pm CET / 12pm EST | March 17 2026
Your all-in-one load testing platform
Design complex tests, manage global infrastructure, and turn results into action on one powerful platform.
Need technical references and tutorials?
Minimal features, for local use only
