
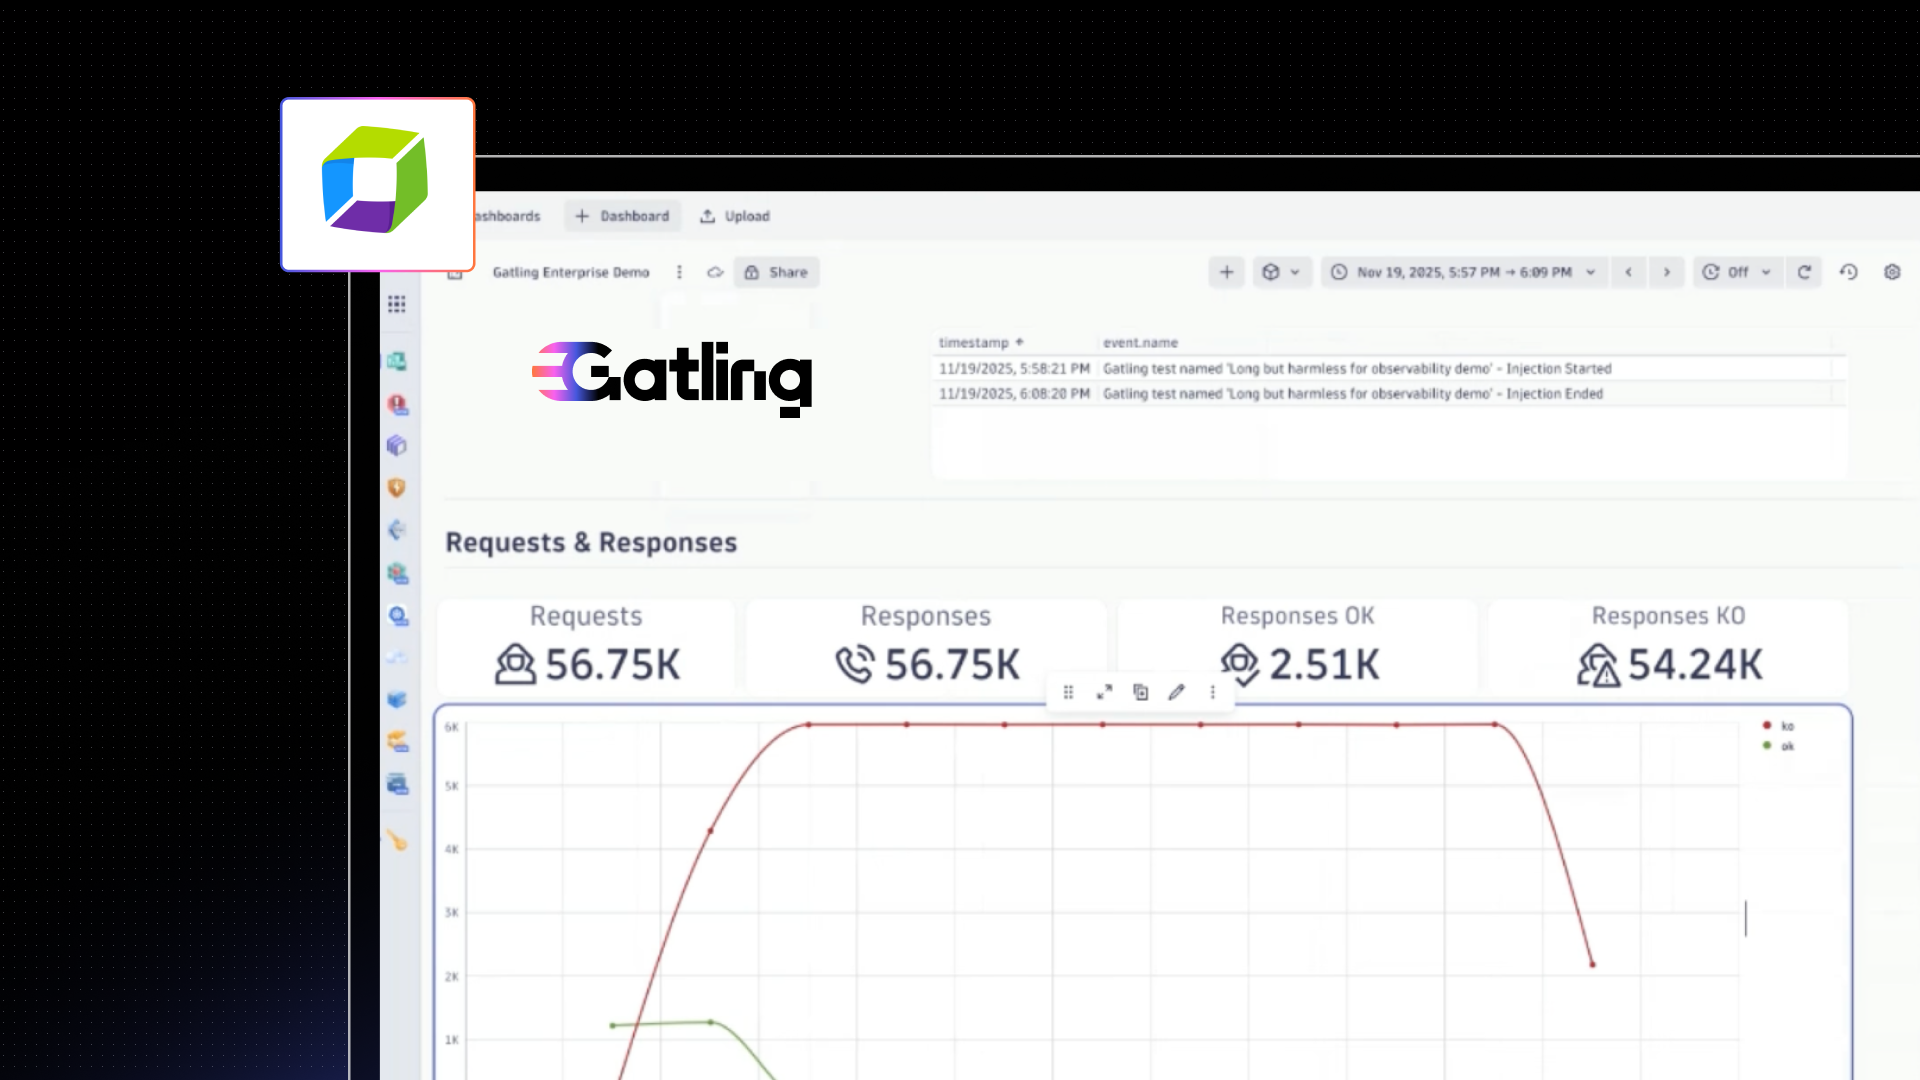
See load test impact in real time
Send Gatling Enterprise Edition load test metrics directly to Dynatrace and analyze performance under real traffic conditions. Correlate response times, error rates, and throughput with infrastructure and application signals in one place.
Correlate load with observability data
Push Gatling load test metrics into Dynatrace and overlay them with:
- CPU, memory, and network usage
- Application traces and logs
- Infrastructure saturation signals
See exactly when and why performance degrades as load increases.
From “we saw it in prod” to “we know why”
By combining controlled load from Gatling with Dynatrace observability, you can:
- Reproduce performance issues on demand
- Identify bottlenecks faster
- Validate fixes before release
No guesswork. Just clear cause-and-effect.
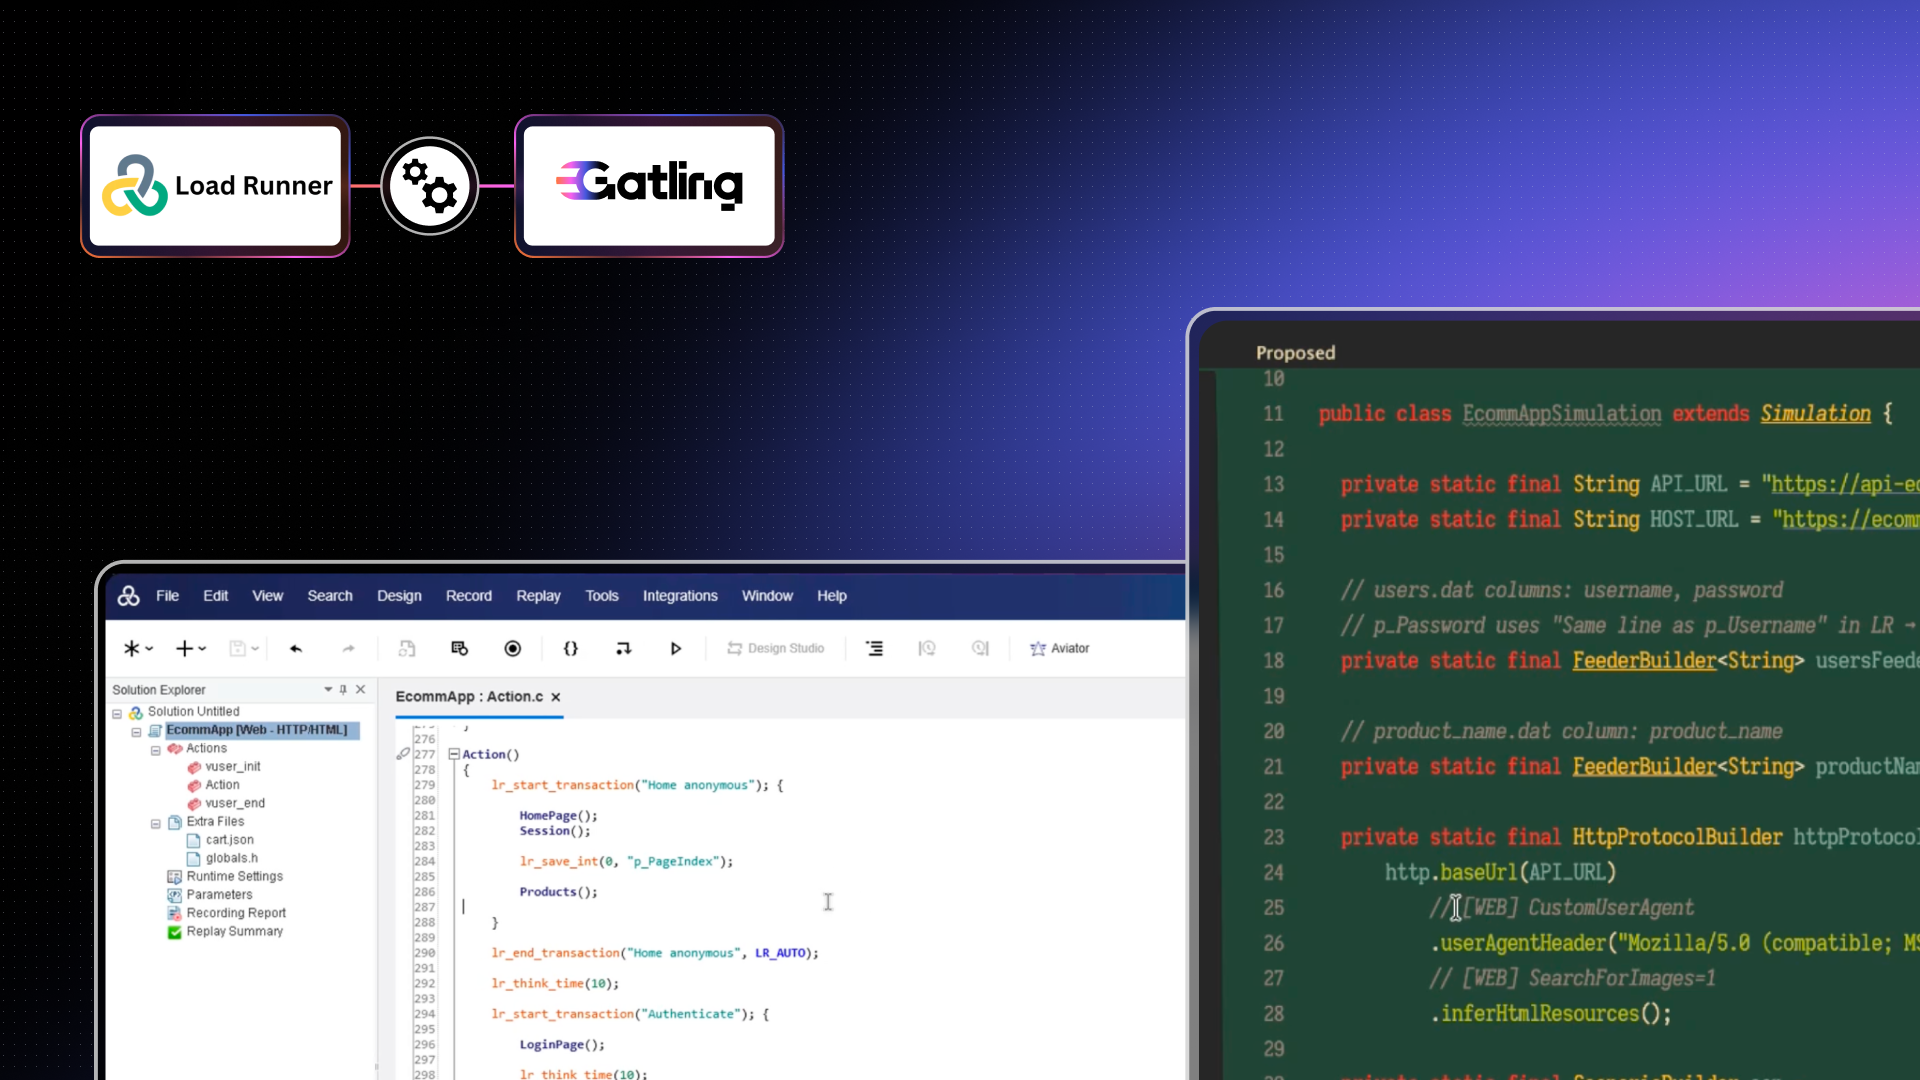
Enrich every request with test context
Add custom Dynatrace headers to all Gatling-generated requests. Pass context like:
- virtual user ID
- scenario and test step names
- load test execution identifiers
Filter, tag, and analyze Dynatrace data based on real test behavior.
Built for secure, private environments
The Dynatrace integration works with private locations, keeping traffic and metrics inside your network. You stay in control of data flow, access, and connectivity.
This integration is available on Gatling Enterprise Edition only.
Explore our plans to see how Gatling fits into your observability stack.
Related updates
Your all-in-one load testing platform
Design complex tests, manage global infrastructure, and turn results into action on one powerful platform.
Need technical references and tutorials?
Minimal features, for local use only
