
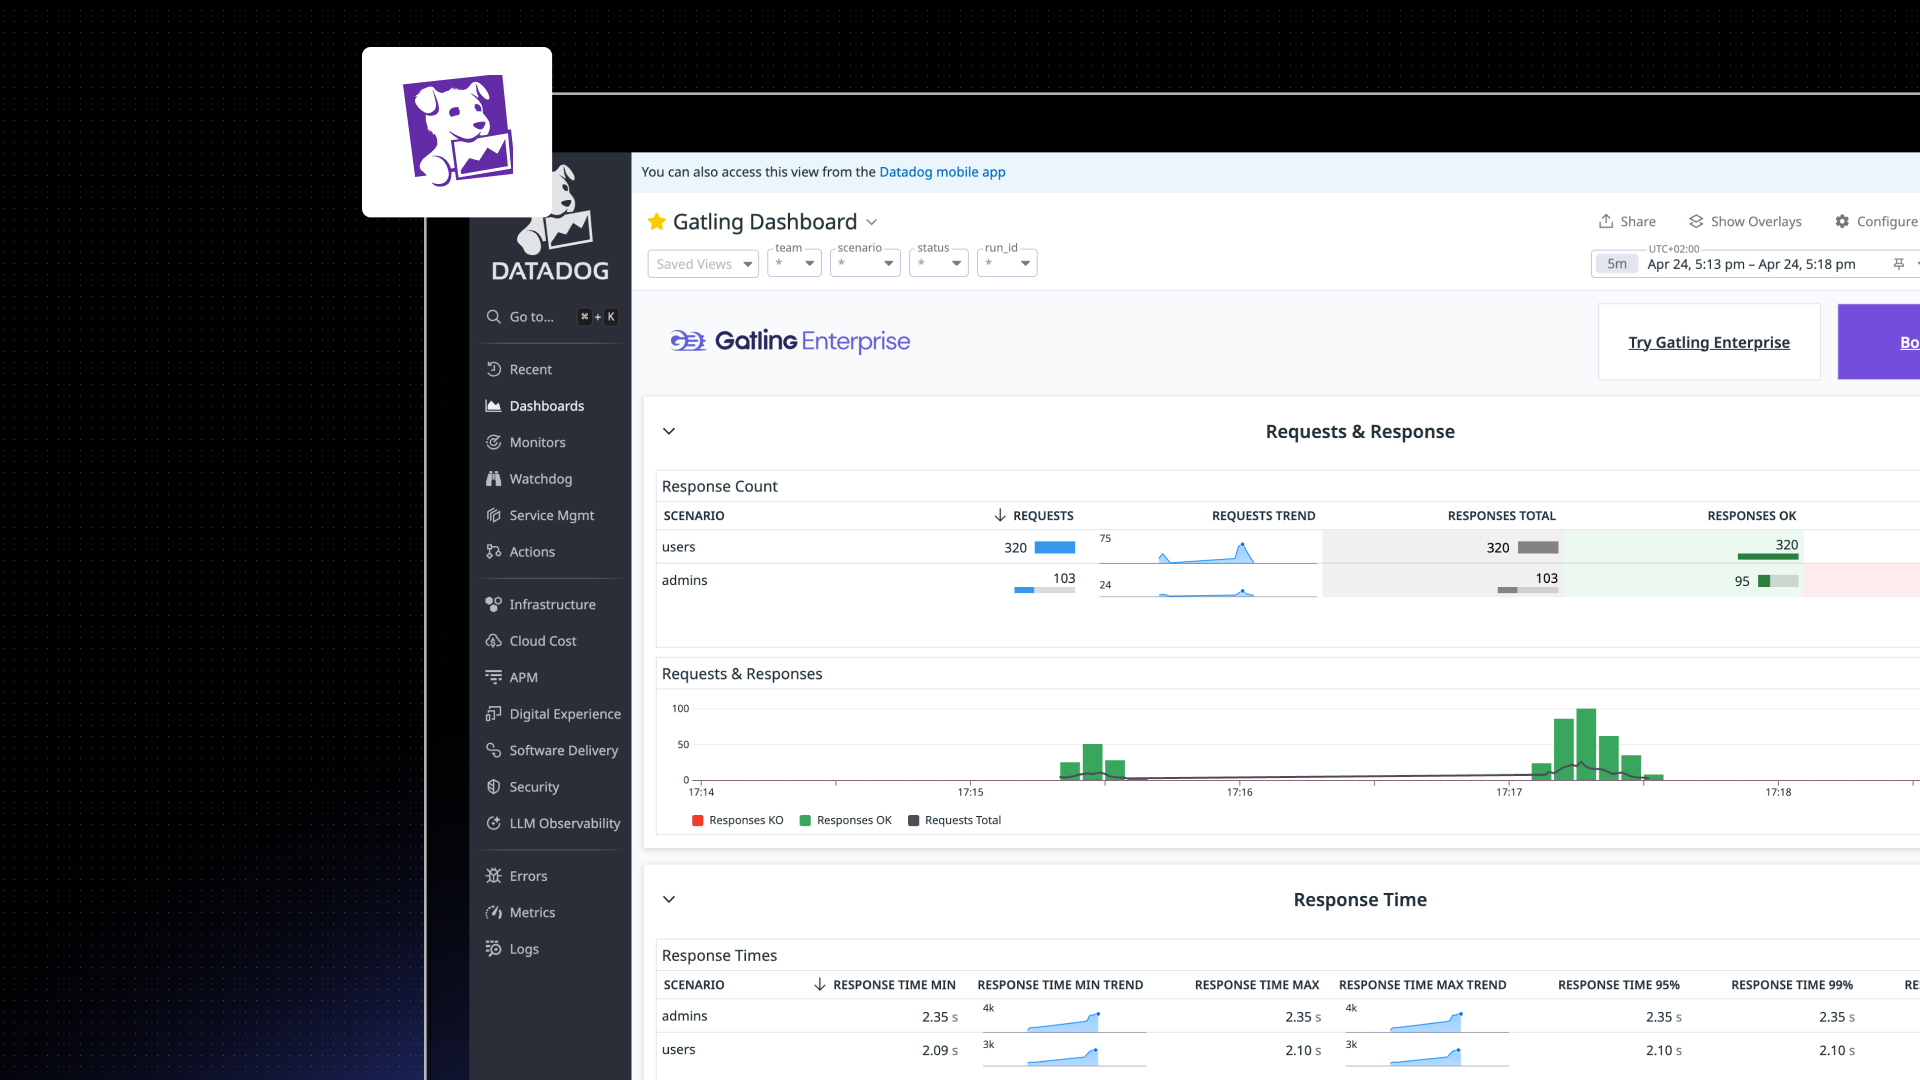
Monitor load tests alongside your production metrics
Stream key load-testing metrics—response times, throughput, error rates—into Datadog. View Gatling scenarios next to CPU, memory, network, traces, and logs in unified dashboards.
Investigate performance issues with full context
Overlay Gatling load-test data on Datadog traces and resource utilization charts to understand how your system behaves under load. Identify bottlenecks faster by connecting user traffic to infrastructure impact.
Built for enterprise observability workflows
The Datadog integration is designed for Gatling Enterprise Edition with private locations. Load-test events and metrics are tagged automatically, making it easy to filter, group, and analyze runs across teams, tests, and environments.
Send metrics, keep control
Metrics and events are pushed securely using your Datadog API and application keys. You stay in control of where data is sent and how it’s used inside your Datadog account.
Related updates
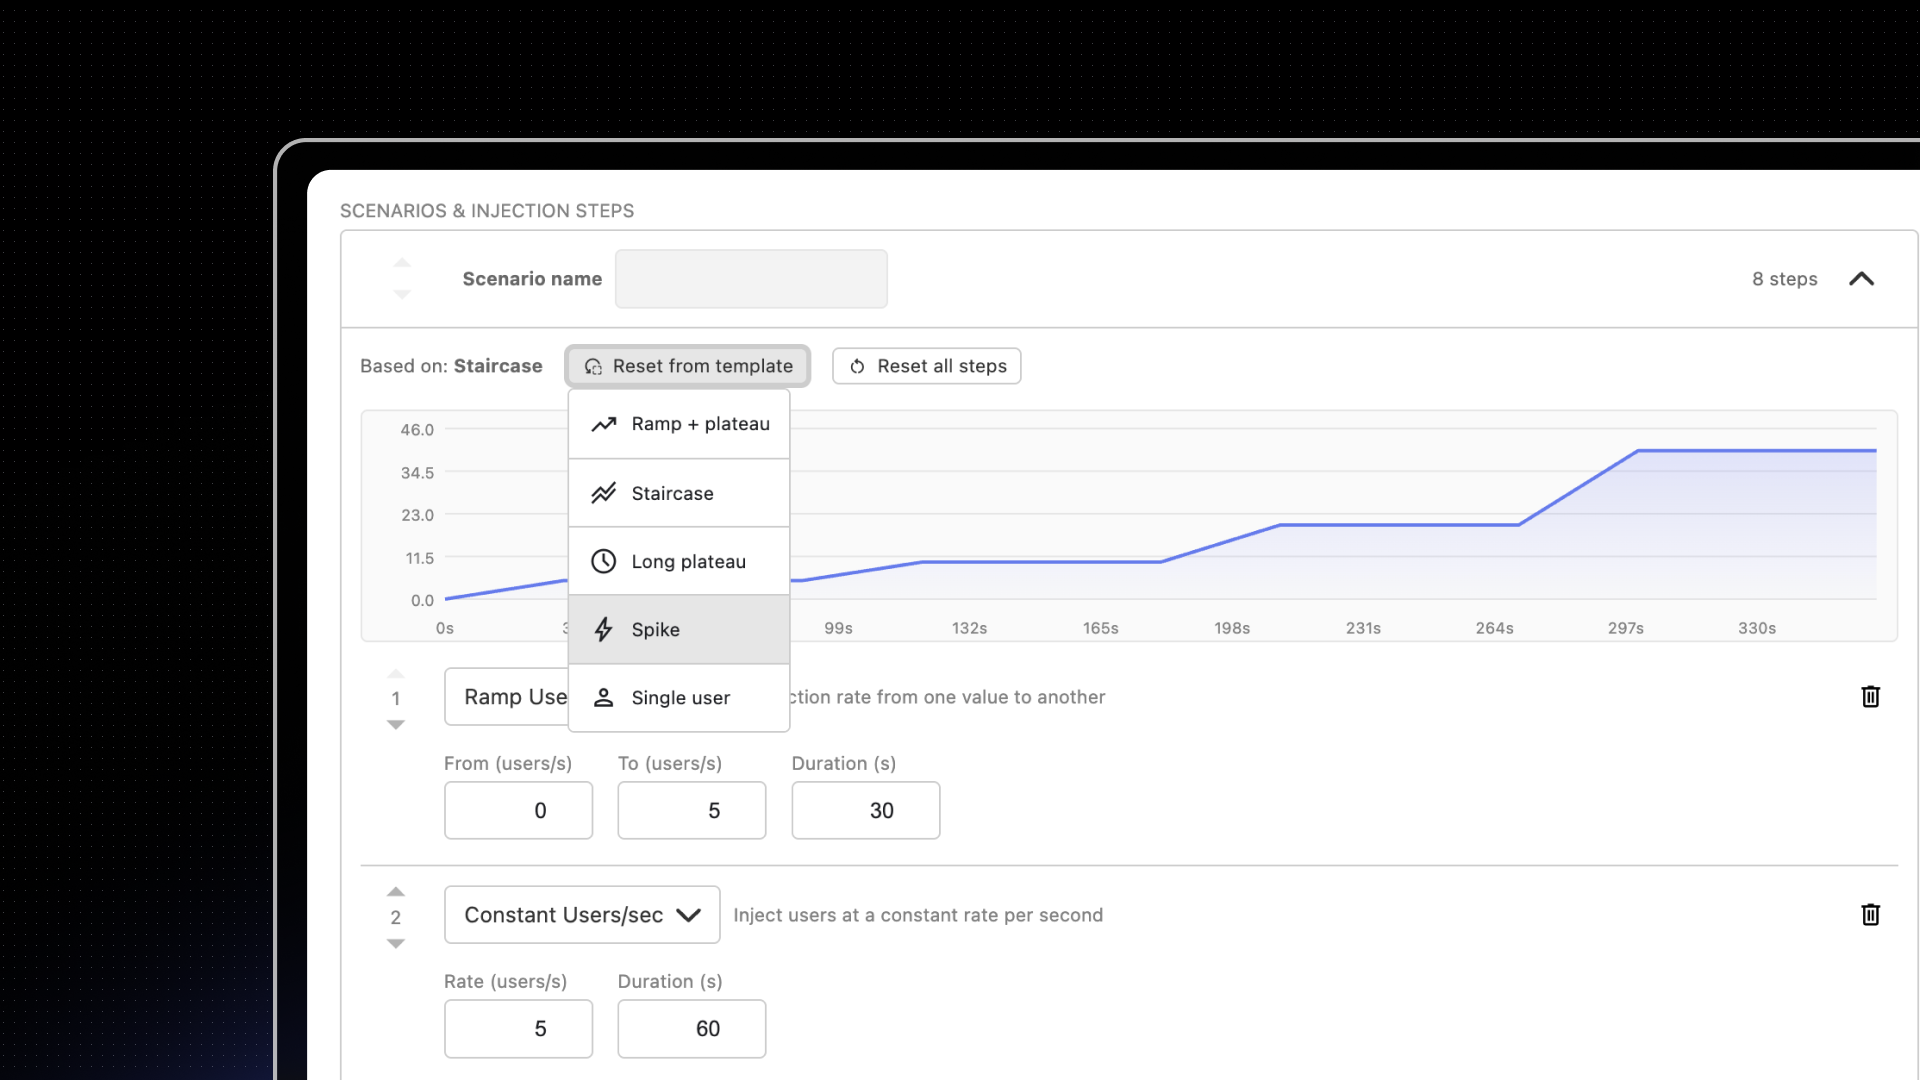
Your all-in-one load testing platform
Design complex tests, manage global infrastructure, and turn results into action on one powerful platform.
Need technical references and tutorials?
Minimal features, for local use only
