Let's cut right to the chase and state how it is. Mean and standard deviation aren't helpful as metrics and analysis in load testing. They can be very deceptive, with multiple analysis bias. If you are uncomfortable with Gatling reports analysis, we advise you to start with our other analytics article. As for Cloud users, we also have that covered in an article dedicated to Cloud reports.
We use most of our time to look at metrics while doing load testing. Thus, we need to ensure it is spent as efficiently as possible. With that in mind, which metrics should we use to have a clear view of what is happening at any time? Are these helpful? Metrics - An Analysis of Load Testing is all about digging into common metrics, understanding their common pitfalls, and avoiding missing changes in your application behavior during load testing.
Definitions
Mean
The mean—arithmetic average describes the central value of a data set. The standard definition is the sum of all parts divided by the number of parts. Hence, for parts :
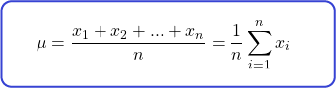
The arithmetic average, also written ̄, summarizes central tendency. It is easy to use, compute, and, so far, widely used.
Variance
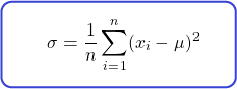
The variance is a bit more involved. It describes how much values are spread around the mean. You can find the variance by subtracting each part of the data set by its arithmetic average, squared, then dividing by the number of parts.
Before we dive into its actual sense, let's go right to the standard deviation.
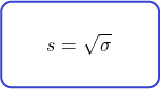
Standard deviation
The standard deviation is the same as the variance. You express it in the same unit as the mean, whereas you express the variance in squared units. You can use both interchangeably as long as you are rigorous with what units you are using.
Is it easier to consider the standard deviation as a description of variability rather than its formula? This is all the mathematics we'll see for today. Hope you're okay.
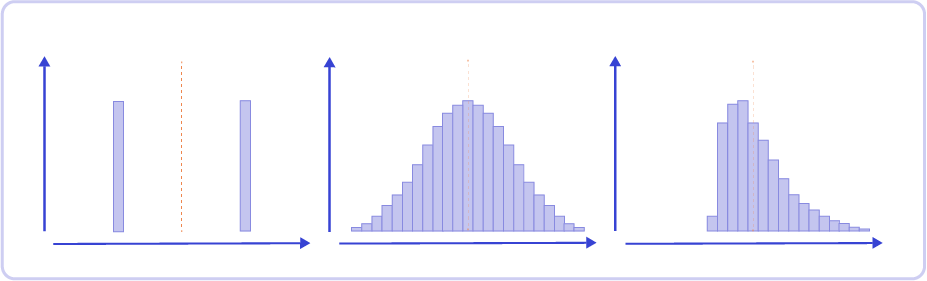
A little bonus: you can differentiate distributions with the same arithmetic average by their standard deviation:
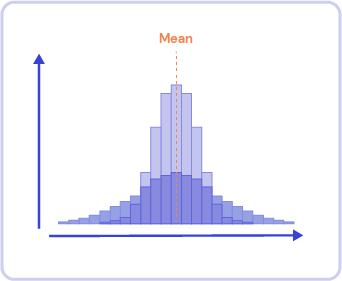
Two distributions with the same average but different standard deviations
Why does deviation matter in load testing?
When you use variance and/or standard deviation as metrics, you must ensure which distribution you are dealing with. Knowing how much your data set is spread around the mean doesn't account for much if you have no idea how the data looks in the first place.
Even worse, how to make sense of the standard deviation if your data is shared between multiple binomial distributions—or multi-modal distributions, like this one:
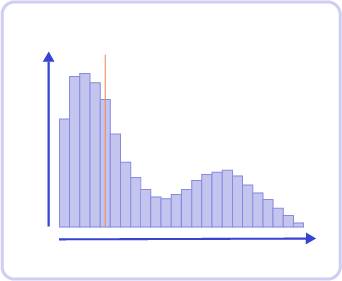
Multi-modal distribution, showing its arithmetic average, doesn't tell much about its shape
Such a data set could be split into multiple sub-data sets and then studied individually. Arguably, that would be cumbersome, defeating our initial purpose of gaining time when analyzing our metrics.
Furthermore, what happens when the mean and standard deviation are the same? Does this mean the data sets are the same? It is easy to craft distributions with these kinds of properties:
Multiple distributions sharing the same arithmetic average and standard deviation
Some people went even further and squashed all sorts of shapes with the same average standard deviation on both axes in a single animation. That says a lot about how deviations are as a metric.
https://edubirdie.com/blog/same-stats-different-graphs
As you understand now, variance and standard deviation only make sense on Gaussian distributions, which are rarely encountered in load testing. The most common cases are multi-modal distributions, outliers or extreme values, long tails or skewed distributions, etc.
The arithmetic average is very sensitive to outliers, and it won't tell us much about the shape of the distribution anyway. We would need a more powerful tool to deal with all these cases, which could be stated as extreme if they were not so common!
Then, why are they used?
Mean and standard deviation are metrics that are easy to use and compute. However, they will only be efficient if the distribution is perfectly shaped—i.e., symmetric. That is not the case in the world of load testing by far.
But then, what to do? What metrics can you use for a good analysis? You can find some answers if you return to a load test's objectives. Ultimately, you must understand what you want to unveil before choosing the good indicators to follow.
Share this

My first Gatling Test Report

Load Testing AWS SQS with Gatling