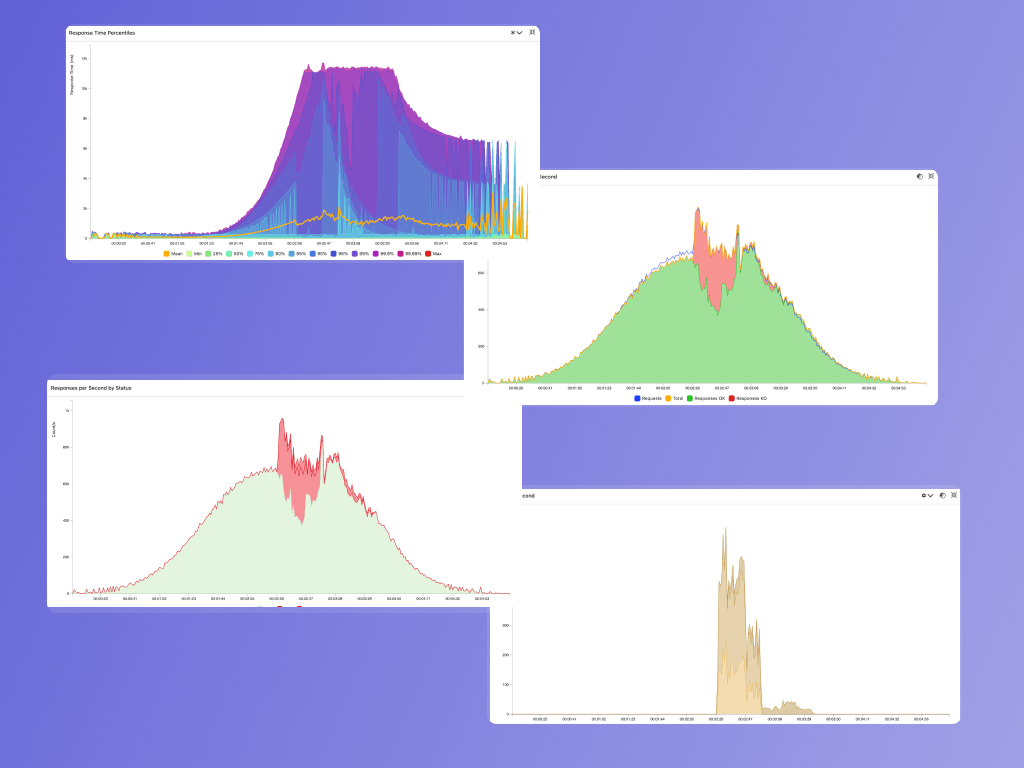
In-Depth Performance Metrics
Gatling's Advanced Dashboards offer comprehensive reports with these key features:
- Breakdown of request-response data into easy-to-understand metrics, with reporting by groups and scenarios
- Error occurrence tracking with specific error codes
- Inclusion of detailed measurements such as:
- DNS resolution times
- TLS handshake durations
- TCP connection details
- and much more!
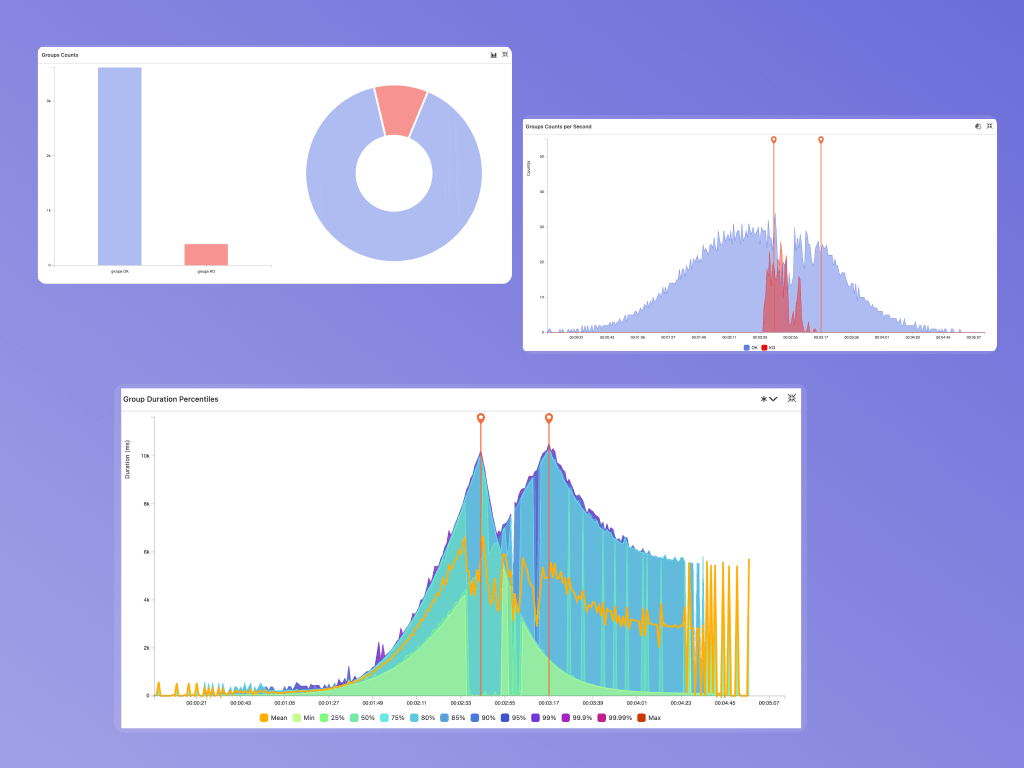
Customizable Dashboard Views
Gatling empowers you to customize your dashboard views, allowing you to prioritize the data most crucial to your performance strategy. This flexibility helps you stay focused on your goals.
- Use filters to spotlight a single troublesome endpoint's performance.
- Utilize pins to easily reveal correlations between different metrics.
- Switch between various graph types and data tables to find the display that best showcases your successes and highlights areas for future improvement.
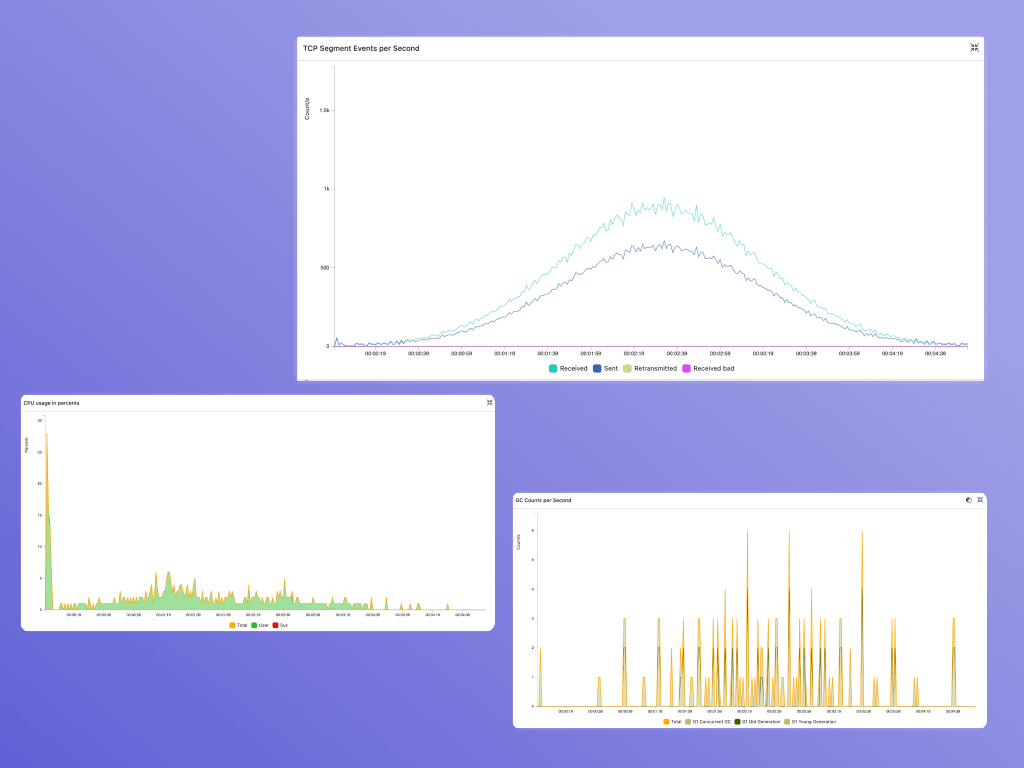
Load Generator Health
It's crucial to ensure you're testing your application's performance rather than saturating your load generators. While the Gatling load engine is highly efficient, it's still possible to exceed its capacity. To guarantee your tests accurately evaluate your application's performance, we provide detailed load generator health metrics. Monitor your load generator for the following:
- CPU usage
- Heap usage
- TCP connection details
- Garbage collection