This article is a continuation of a previous article titled Metrics and Analysis of Load Testing Part 1. Whilst that article discussed the use of mean and standard deviation for load testing analysis, this article focuses predominantly on interpreting and analyzing latency percentiles in our load test results.
We’ll explore what latency percentiles are, discuss why they are so critical for load testing results analysis, and see how they can be used in Gatling Enterprise.
Latency Percentiles Explained
In any dataset (such as transaction response times), each percentile that you calculate will tell you the value at which a percentage of your data is included. So for example the 80th percentile is the value that is greater than or equal to 80% of all the other values in your dataset.
Using latency percentiles is significantly different from calculating the average. The average response time of your server or application can be significantly skewed by a handful of extreme results, as explained in this article on What is Load Testing?.
Some of the most common latency percentiles typically used in load testing are the 90th, 95th, and 99th percentile latency. Let’s discuss each of these below:
What does 90th percentile latency mean?
Taking all the request-response times in our load testing results, the 90th percentile latency is the value at which 90% of our requests will be completed by.
For example, if we calculated the 90th percentile of our transaction response times to be 500 milliseconds, we could say that 90% of the requests to the server in our load test took 500 milliseconds or less to get a response.
From looking at this metric, we can determine that the other 10% of requests will take more than 500 milliseconds to get a response. Whilst this metric alone is somewhat useful, we need to use it in conjunction with other percentiles (such as 95th and 99th) to get a better understanding of the response times from our service during the load test.
What is 95th or 99th percentile latency?
A leading practice in load testing analysis is to calculate the 95th and/or 99th percentile latency of the application. These percentiles are often referred to as tail latency distribution. The latencies we calculate here will tell us the highest response time that 95% or 99% of our users are experiencing from our service.
For example, if we calculated the 95th percentile latency to be 1000 ms, then we would be able to state that 95% of the requests to the system were completed within 1000 ms or less.
In a similar manner, the 99th percentile latency tells us the time in which 99% of the requests to the server will return a response. So for example, if the 99th percentile latency was 2000 ms, then 99% of the requests in our dataset of load testing results would respond in 2000 ms or less.
We’ll next discuss how these latency percentiles are calculated.
How is Percentile Latency Calculated?
Suppose we intend to calculate the 95th percentile latency manually from our system performance testing results. In that case, a simple method is to sort all the values and choose the value at the 95/100th position to measure the 95th percentile latency.
For example, let’s imagine a dataset of 1000 latency values is available. In that case, the values can be placed in an array sorted into order, and the value at the 950th index can be selected as the 95th percentile latency value. This value represents the latency value that 95% of the data points are below. It is a simple and easy method to calculate the 95th percentile latency value.
Load testing results will often consist of many thousands of data points, and these data points will typically be spread across multiple different load testing agents when we are doing distributed load testing. Calculating multiple different percentiles (such as the 80th, 90th, 99th etc.) using the straightforward technique above becomes a resource-intensive exercise.
We must rely on other techniques such as Histogram approximation to calculate percentile latency. Although these percentile latencies are actually approximations (rather than exact figures), they are accurate enough that the difference between the approximation and actual value is negligible.
Using these approximation techniques causes latency percentiles calculated in Gatling load test results to be less than 10% in error. For example, if the 90th percentile is displayed in Gatling as 200ms, the actual latency will be somewhere between 180ms and 220ms.
Note that Gatling will round values to the nearest integer before computation. So for example, if the 90th percentile is showing as 8ms, initially we might think the actual latency is between 7.2ms and 8.8ms. Since each latency value is rounded separately before being put in the histogram, the actual latency percentile is between 7.5ms and 8.4999ms in this case.
If you are interested in learning more about how percentile latency is calculated with these techniques, check out this article on Measuring Percentile Latency.
Latency Percentiles in Gatling Enterprise
In order for latency percentiles to be useful in load testing analysis, we need to calculate multiple latency percentile values that help us to form a bigger picture. For example, if we take our 90th percentile of 1000 ms in isolation, it doesn’t give us any indication of the response times for the 10% of transactions that are above this.
Likewise, if we take a 99th percentile of 5000 ms in isolation, it doesn’t give us any indication of how the response times below this percentile are distributed. Most of the requests below the 99th percentile could have a response time significantly lower than 5000 ms, or most could be just a few milliseconds below. There is no way to tell from using these single percentiles in isolation.
This is why we must compare multiple different latency percentile values to get an accurate picture of our load testing results.
Gatling Enterprise displays multiple latency percentiles that can all be viewed in the load testing results dashboard in real-time:
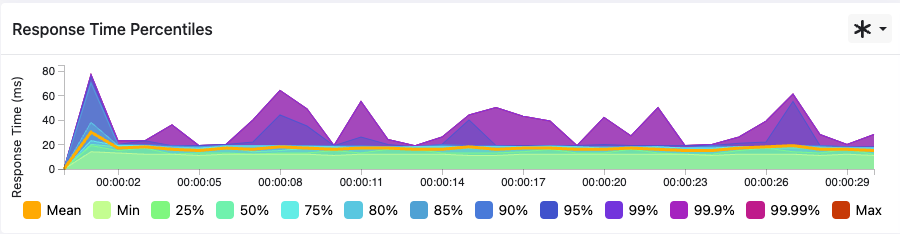
Users of Gatling Enterprise can toggle between all of the percentiles shown in the screenshot above on their dashboard, from 25% right up to 99.99%. As well as the different percentiles, other informational metrics like the mean, min and max response time are also displayed.
The ability to view and compare latency percentiles of system traffic in this way gives an accurate representation of the response times that your end users are experiencing from your system.
Summary
In this article, we’ve explored latency percentiles in load testing and discussed some of the most common ones that are used in performance testing results analysis. We’ve discussed how these latency percentiles are calculated, and why it’s so important to measure multiple latency percentiles when evaluating your load test results.
To learn more about how Gatling can help with your load testing efforts, this article on CI/CD Integration explains more about how Gatling can integrate performance testing directly into your development pipeline.
Gatling Enterprise enables the deployment of distributed load testing infrastructure in the cloud or on-premises with just a few clicks. In addition to monitoring test results with latency percentiles in real-time, Gatling Enterprise offers a number of other significant features that will bring success to your load testing efforts.
Share this

Is Your LLM API ready for real-world load?

What are the objectives of load testing?