
Analyze smarter
and act faster
Track every critical performance metric, detect bottlenecks early, and share actionable insights with your team. Gatling Enterprise turns raw data into real-time visibility, enabling faster, data-driven decisions.
REPLAY
Bring Gatling Results to Datadog
Learn how to run real-world load tests and explore
how to surface metrics in Datadog for instant visibility.


Spot problems
before your users do
Early detection
of performance risks
Identify bottlenecks and anomalies before they impact production with real-time event tracking and regression detection.
Data you can trust,
at scale
Every request and response is captured in full resolution, even under millions of requests per minute, no sampling, no guesswork.
Actionable insights
for every stakeholder
From QA to executives, tailor reports and dashboards that provide the right level of detail for better alignment and faster decisions.
INTERACTIVE DEMO
Feel the power of real-time analytics
Explore live dashboards, apply filters, and surface insights effortlessly,
just like in your own workflow.
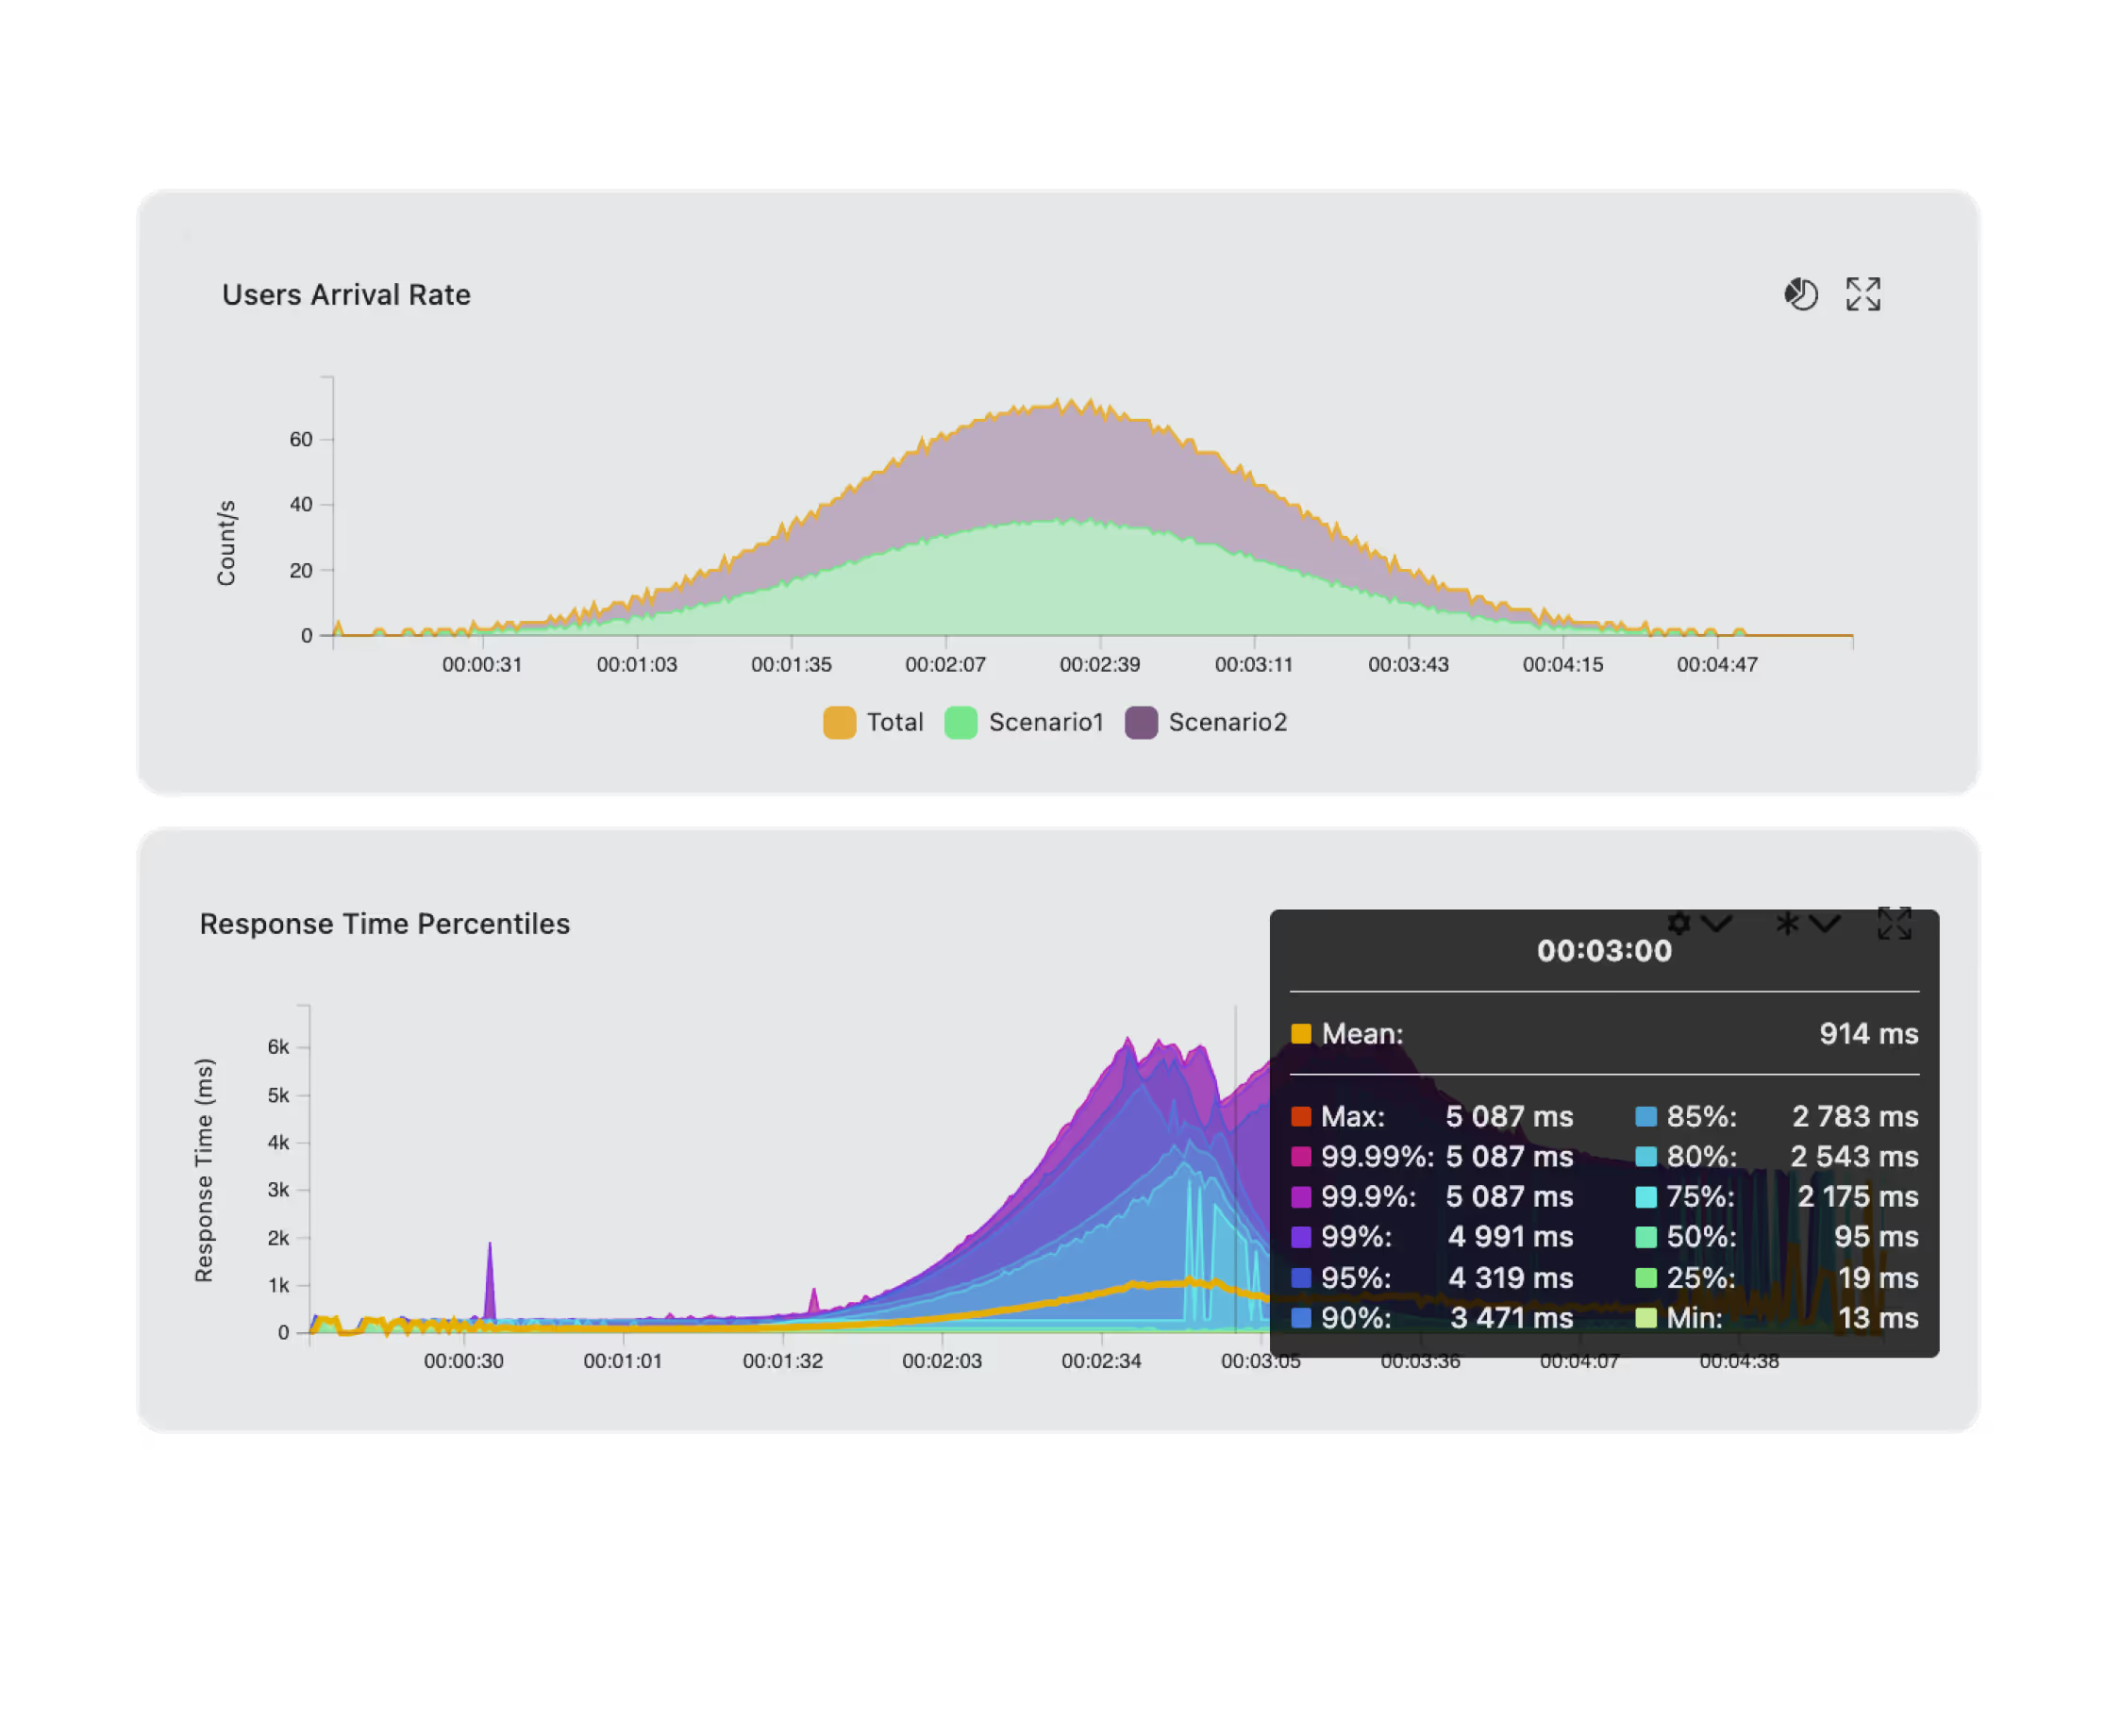
OUR VARIETY OF METRICS
Unlock the full spectrum of performance metrics
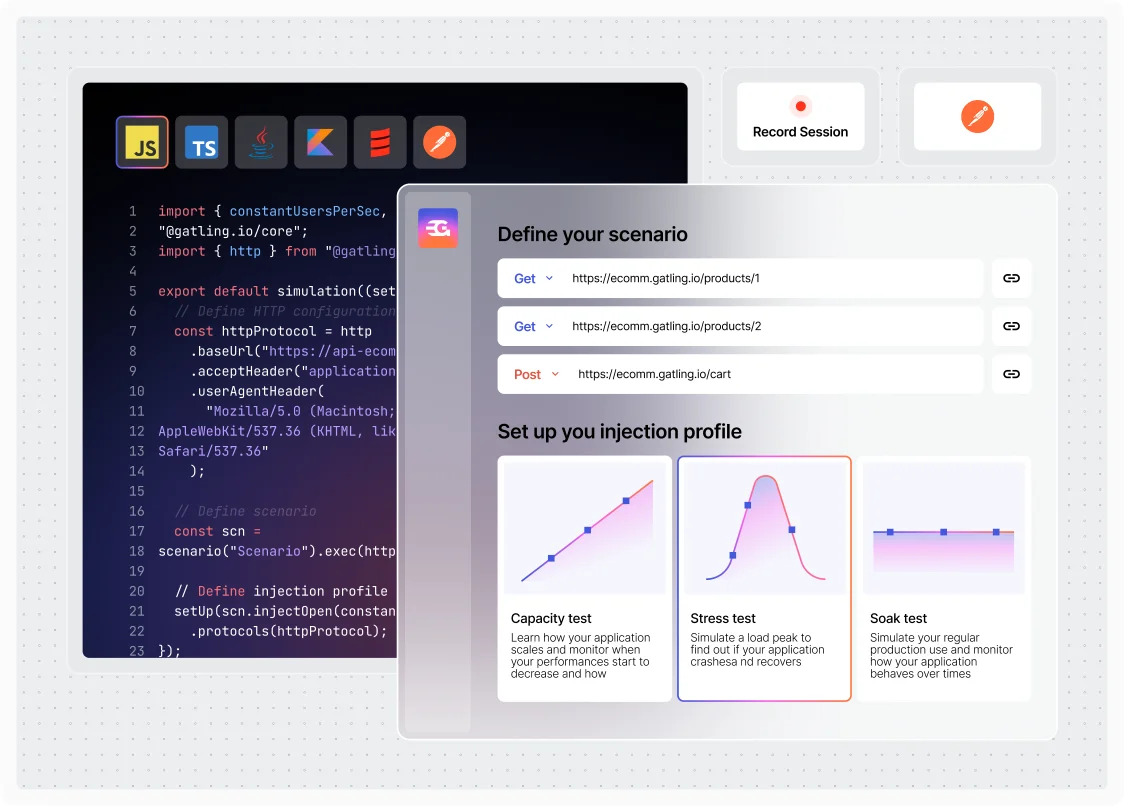
With Gatling, your entire load testing strategy becomes code you control, flexible, versioned, and infinitely customizable.
Design every aspect of your load tests programmatically
with Gatling’s powerful SDKs (Java, Scala, Kotlin, JavaScript, TypeScript)
Full virtual user behavior metrics
Monitor the number of concurrent virtual users throughout the test
Track the maximum virtual users reached during peak load
Measure request and response rates per second with precision
Identify errors by their type and frequency to uncover root causes
Deep test visibility
Apply custom grouping and logic to segment test results
Analyze detailed connection metrics, including TCP and TLS performance
View complete DNS resolution metrics for every request
Break down status codes and throughput for comprehensive analysis

Load generator insights
Keep track of CPU usage across load generators
Monitor heap memory usage to prevent resource bottlenecks
Analyze TCP connections to ensure reliable performance under stress

Built-in reports and features
Real-time performance insights with structured, actionable data
Turn load testing into part of your dev workflow.
With Gatling, tests are code—flexible, versioned, and easy to maintain

Run trends
Follow performance evolution across recent runs
Identify regressions and improvements at a glance

Run comparison
Side-by-side analysis of key performance metrics
Focus on specific scenarios, time windows, and KPIs

Test history
Access all past test runs and comments
Compare current tests with past baselines

Interactive dashboards
Filter, sort, and deep-dive into metrics (live & post-test)
Event markers synced across all charts
Fully UI-based experience, no manual digging required

SHARING REPORTS
Share actionable results with custom-tailored reporting
We help you communicate performance findings with clarity and confidence across your entire organization.
Create reports your stakeholders will actually read.

Contextualized results
Add Notes, mark anomalies, and ensure stakeholder alignment
Public and shareable links
No login needed
to view key reports
Multiple export formats
PDF & CSV to fit any audience
Push data where your team is
Slack, MS Teams, Webhooks, and Jira
Personalized templates
Create and save templates for consistent reporting
OBSERVABILITY TOOLS INTEGRATIONS
Load test results, directly in your favorite monitoring tool
By combining Gatling’s load testing metrics with real-time observability data, teams can correlate performance under stress with live application behavior.
This holistic view helps pinpoint bottlenecks, memory leaks, or latency spikes at the infrastructure, network, or code level.

Unified performance insights
Merge test data with real-time monitoring for full context
Faster troubleshooting
Quickly identify and resolve bottlenecks under load
Smarter release decisions
Validate system stability before every deployment
Team-wide alignment
Share a single source of truth across Dev, QA, and Ops
PLATFORM
Our platform in action
From test design to insight sharing, Gatling gives you full control of your load testing strategy

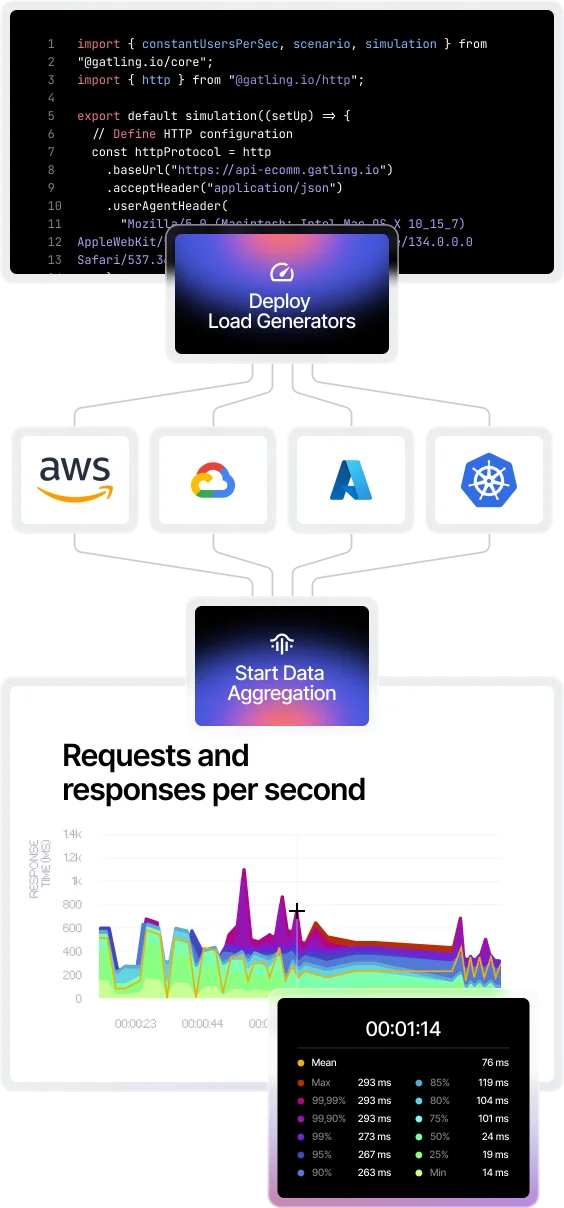
Automation
Automate load testing from code to production.
Eliminate manual configuration, integrate seamlessly with CI/CD, and let intelligent automation handle the repetitive work, so your teams can focus on delivering fast, reliable software.


FAQ
Frequently Asked Questions about insights and analysis
Everything you need to know about Gatling’s real-time reporting, dashboards, and performance visibility.
Test results retention depends on your plan and configuration. Enterprise offers customizable data retention policies to ensure you never lose critical performance history.
Yes. Enterprise enables side-by-side comparisons of multiple test runs, highlighting regressions, improvements, and trends across any chosen KPIs or timeframes.
Absolutely. With customizable dashboards and report templates, you can limit views to only the most relevant metrics, ensuring each audience gets the right level of detail.
Yes. Enterprise integrates with SSO and offers role-based access to manage who can view, edit, or share dashboards and reports.
Yes. Gatling can push performance metrics to observability and APM tools like Datadog or Dynatrace. You can also export reports in PDF or CSV formats for offline analysis.
Ready to unlock enterprise-grade insights?
Start building a performance strategy that scales with your business.
Need technical references and tutorials?
Minimal features, for local use only
