
Table of contents
Scaling load tests the right way


Last updated on
Thursday
January
2026
Scaling load tests the right way: IP sharing, port limits, and JVM warmup
Load testing looks simple on the surface—simulate traffic and observe behavior—but scaling it correctly is one of the hardest engineering tasks you’ll take on. A realistic load test requires not just modeling user behavior, but understanding the infrastructure that generates that behavior. Details like ephemeral port exhaustion, JVM warmup behavior, and CPU saturation can skew your results long before your system ever struggles.
This article explains the practical considerations behind scaling load tests effectively and shows how to avoid measuring the limitations of your load injectors instead of your system.
⚡ TL;DR
Most load tests fail because the load injectors—not the system under test—hit their own limits. CPU, memory, and ephemeral ports all cap how much traffic a single injector can generate. If you’re CPU-bound, adding more instances is enough; if you’re port-limited, you must add more source IPs.
JVM-based tools also require a warmup phase so JIT and GC stabilize before real measurements begin. When you outgrow a single injector, distributed execution, OS tuning, and proper monitoring become essential—capabilities handled automatically by Gatling Enterprise Edition.
Understanding the hard limits: CPU, memory, and ports
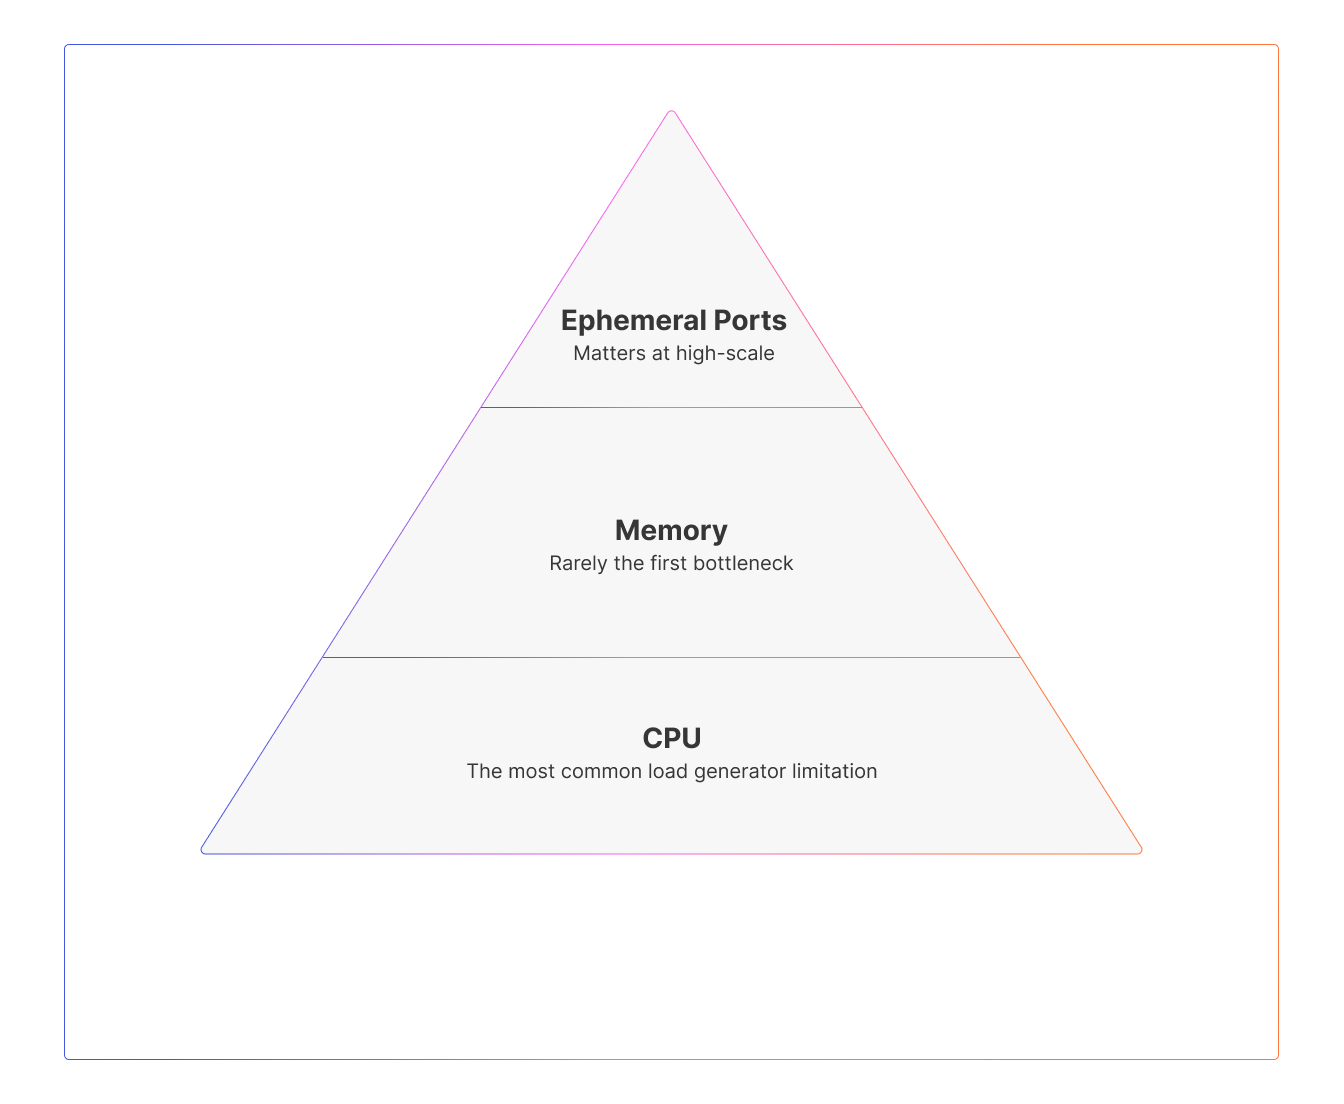
A single load injector is constrained by three primary resources: CPU, memory, and ephemeral ports. Each of these can cap your scalability, but they do so in different ways.
CPU
Every connection consumes CPU cycles—for TLS handshakes, request parsing, response processing, and metrics handling. CPU is often the first resource to saturate because modern systems use encryption heavily and payloads are rarely trivial. When CPU approaches 80% or higher, latency frequently increases even if other resources appear healthy.
If you see rising latency or throughput ceilings alongside elevated CPU utilization, you are likely CPU-bound. In this scenario, sharing IPs is not a concern; the straightforward fix is more vCPUs or more injector instances.
Memory
Memory tends to be a secondary concern thanks to efficient async frameworks like Netty and Akka. Each connection consumes some memory through socket buffers and inflight data, but modern runtime designs minimize this overhead. Memory becomes significant mainly when millions of concurrent sockets are in play or when an injector encounters a leak or inappropriate garbage-collection behavior.
You’re likely memory-limited if heap use climbs steadily over time or if GC pauses become erratic. These symptoms indicate that the JVM’s allocation patterns are not yet stabilized—or that the load scenario holds more state than expected.
Ephemeral ports
Ephemeral ports are the least visible and most often misunderstood limit. Each TCP connection must use a unique combination of source IP, source port, destination IP, and destination port. Because each source IP only has roughly 65,000 ephemeral ports available, tests involving many concurrent connections or high connection churn can exhaust this range quickly.
Unlike CPU and memory issues, port exhaustion often presents as intermittent connection errors, “address already in use” messages, or unexplained drops in throughput. This happens even when CPU and memory have plenty of headroom, which makes port analysis essential for high-scale tests.
How Gatling helps with scaling challenges
Gatling was designed specifically to address the inefficiencies that plague traditional load testing tools.
- High-efficiency async engine: Gatling's non-blocking architecture dramatically reduces CPU and memory consumption per virtual user. Where thread-based tools might need 1GB of RAM per 1,000 users, Gatling can simulate 10x that on the same hardware.
- Built-in warmup support: Gatling Enterprise Edition makes it easy to structure tests with dedicated warmup phases, and supports recommended JVM tuning patterns out of the box.
- Enterprise distributed execution: Gatling Enterprise Edition provides seamless orchestration of multiple injectors across regions, automatically managing IP distribution, result aggregation, and injector health monitoring—so you can scale to millions of concurrent users without building your own distributed system.
- Real-time injector visibility: During test execution, you can monitor CPU, memory, network, and GC metrics for every injector, ensuring your results reflect system performance, not infrastructure limits.
- OS tuning: Gatling automatically optimizes Enterprise Edition load generators for peak performance.
- Run stop criteria: Prevent invalid results by setting stop criteria based on load generator CPU consumption by automatically halting high-scale tests before injector limits compromise accuracy.
When to share IPs and when to add more
Whether you can share IPs or need additional ones depends entirely on which injector resource is limiting you. CPU and memory issues are solved by adding more instances; port issues are solved only by adding more source IPs.
If CPU is the bottleneck, multiple injectors can safely share an IP address (as they would behind common NAT topologies). If ephemeral ports are the bottleneck, each additional source IP effectively gives you another ~65k possible connections to a given destination. This multiplication effect is vital for tests requiring very high concurrency.
A short example makes the point clear: if you need 200,000 concurrent users against a single endpoint, one source IP cannot supply enough ephemeral ports. Even though the math suggests a minimum of four IPs, in practice, you'd plan for five or six to allow for TIME_WAIT delays and other overhead.
On the other hand, small tests rarely need unique IPs; medium tests may need one or two; and high-scale tests almost always require thoughtful IP planning, sometimes across multiple subnets or regions.
The JVM warmup problem
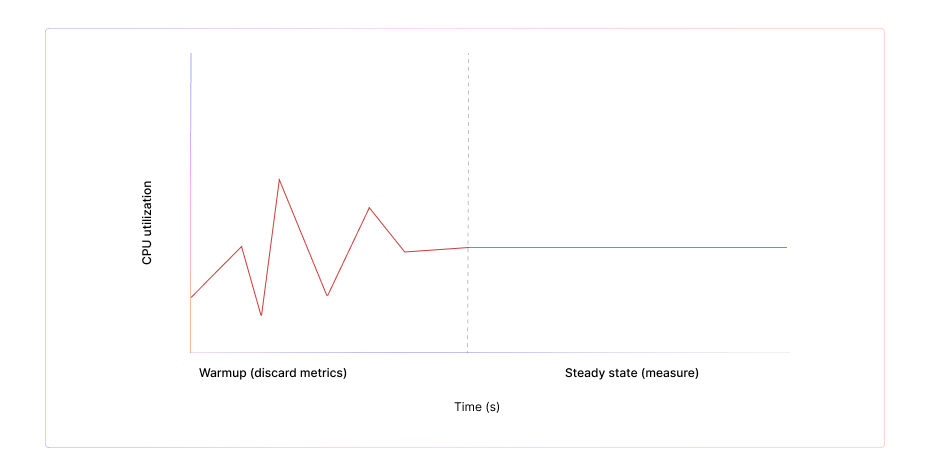
For JVM-based load generators—including Gatling—JVM warmup profoundly affects performance. When the JVM starts, it runs code in an interpreted mode, gradually identifying hot methods and compiling them with the JIT. At the same time, the garbage collector adapts to real allocation patterns.
During this warmup period, latency is artificially high and throughput is artificially low. GC pauses can be noisy, and the injector behaves nothing like it will in steady state. For accurate testing, you must include a warmup phase, discard its metrics, and begin real measurement only once throughput, latency, and GC stabilize.
A simple pattern is to run a warmup load for two to five minutes at your intended rate, ignore all results from that window, and then begin your actual measurement scenario. This ensures your injector is generating load at full efficiency rather than reporting JVM cold-start artifacts.
JVM tuning flags—such as fixed heap sizing (-Xms and -Xmx), G1 garbage collection, tiered compilation, and AlwaysPreTouch—further reduce warmup volatility and produce much more stable injector behavior.
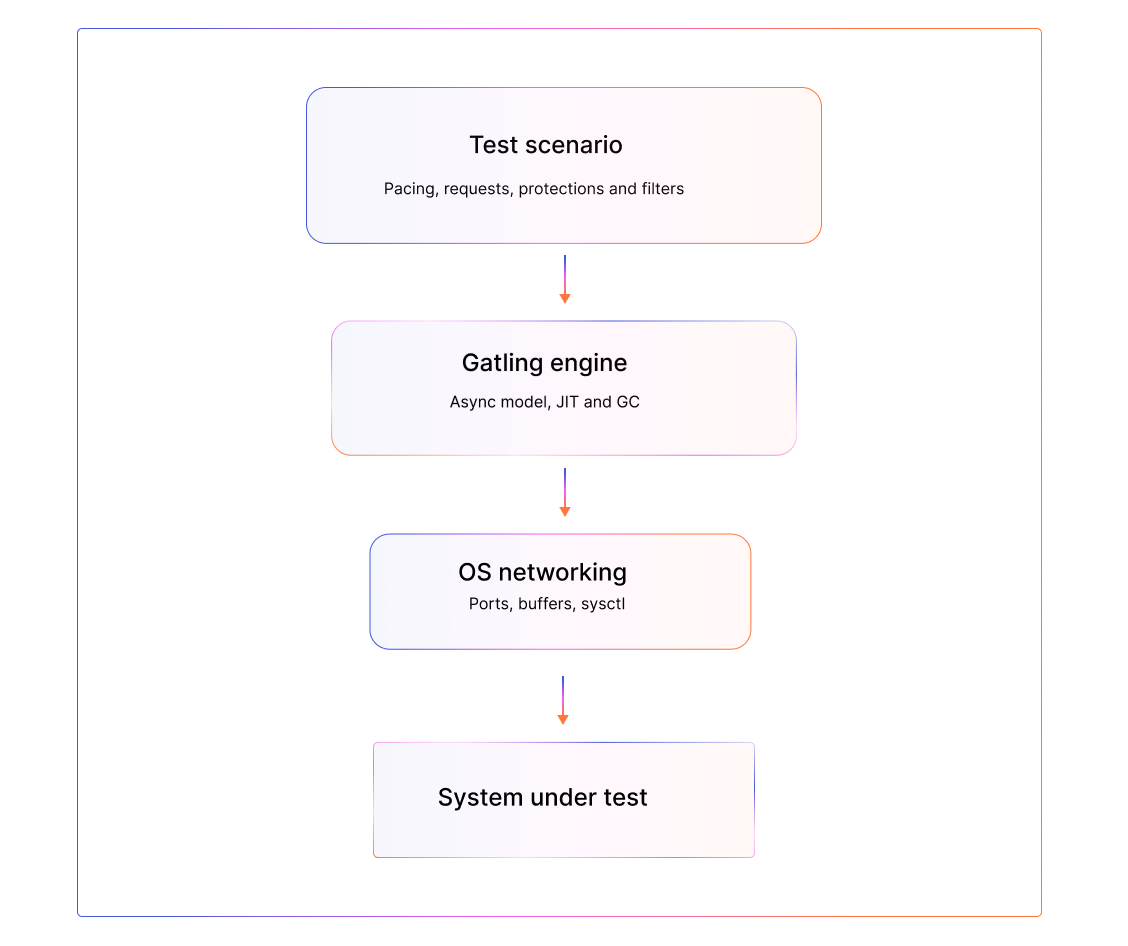
Operating system tuning for high-scale
Even a perfectly tuned JVM depends on underlying OS settings. High-scale tests benefit from widening the ephemeral port range, raising file descriptor limits, allowing safe TIME_WAIT reuse, and increasing connection tracking table capacity. These adjustments aren’t necessary for every test but become significant when you push beyond roughly 50k concurrent connections or very high RPS workloads.
The OS, JVM, and scenario all interact, and failing to adjust a single layer at scale can undercut your test’s credibility.
Monitoring your injectors
Your test is only valid if your injectors remain healthy throughout the entire run. This means monitoring CPU utilization (ideally below 80–85%), memory and GC behavior (stable heaps and predictable pauses), network throughput (to avoid bandwidth saturation), active connections (to detect port pressure early), and injector-side error rates.
When injectors degrade, the test no longer measures your system under test. It measures the limitations of the load generation infrastructure.
Scaling strategies: from single injector to distributed load
A single injector often suffices for tests under 10k users or under 5k RPS, especially when patterns do not aggressively churn connections. But when CPU, memory, or port limits begin to constrain performance, distributing load across multiple injectors becomes necessary.
Distributed testing provides more CPU, more RAM, more bandwidth, and more source IPs—and it also allows you to simulate geographic diversity and avoid IP-based rate limits in your target environment. The challenge is orchestration: coordinating ramp-up timing, synchronizing results, and managing IP pools across multiple nodes.
Gatling Enterprise Edition solves these challenges by handling injector orchestration, IP allocation, result aggregation, warmup structuring, and real-time injector visibility. This lets teams scale safely to very high concurrencies without building their own distributed framework or battling injector instability.
Key takeaways
- A load test is only as strong as the infrastructure generating the load.
- CPU, memory, and ephemeral ports each impose different constraints, and understanding which one limits you determines your scaling strategy.
- JVM-based injectors require a warmup phase before reliable measurement begins.
- OS tuning becomes essential as you approach large-scale tests.
- Monitoring injector health is fundamental for credible results.
- Distributed execution and automated IP management, as provided by Gatling Enterprise Edition, allow you to scale confidently without introducing injector bias.
FAQ
FAQ
How do I know if my load injector is the bottleneck instead of my system under test?
You can identify injector bottlenecks by monitoring core resources during the test: CPU, memory, ephemeral ports, and injector-side errors. If CPU usage climbs above ~80%, if GC pauses become unpredictable, or if you see intermittent connection errors despite healthy backend metrics, your test is constrained by the load generator, not the application. Tools like Gatling Enterprise Edition provide real-time injector visibility so you can validate that injectors remain healthy throughout the run.
When do I need multiple source IPs for load testing?
You need additional IPs when your test becomes ephemeral-port-limited. Each source IP offers ~65,000 usable ephemeral ports, which caps how many concurrent connections a single IP can initiate. High-concurrency or high-churn tests can exhaust this pool even when CPU and memory are fine. If your bottleneck is CPU, you can safely reuse the same IP across multiple injectors. If it’s ports, the only fix is to add more source IPs (or more injectors with distinct IPs). Gatling Enterprise Edition automates IP distribution for large-scale runs.
Why is JVM warmup necessary for accurate load testing?
JVM-based load injectors start in a “cold” state: the JIT compiler hasn’t optimized hot paths, GC hasn’t adapted to real allocation patterns, and throughput/latency are unstable. A warmup phase—typically 2–5 minutes at your target load—allows the JVM to reach steady state. You should discard all warmup metrics and only analyze results once latency, throughput, and GC behavior have stabilized. Gatling Enterprise Edition supports structured warmup phases and recommended JVM tuning flags.
What scaling strategy should I follow when my test outgrows a single injector?
Start by diagnosing what’s limiting you: CPU-bound? Add more vCPUs or more injectors. Memory-bound? Tune heap/GC or distribute load. Port-limited? Add more source IPs or more injectors with unique IPs. As tests scale beyond ~10k concurrent users or several thousand RPS, moving to distributed execution becomes essential. Coordinating ramp-up, managing injector health, ensuring consistent IP usage, and aggregating results are complex problems that Gatling Enterprise Edition solves automatically.
Related articles
.avif)

Ready to move beyond local tests?
Start building a performance strategy that scales with your business.
Need technical references and tutorials?
Minimal features, for local use only
