How to define, validate, and operate Service Level Objectives for your load testing practice, with the metrics that matter, industry benchmarks, and error budgets that govern releases.
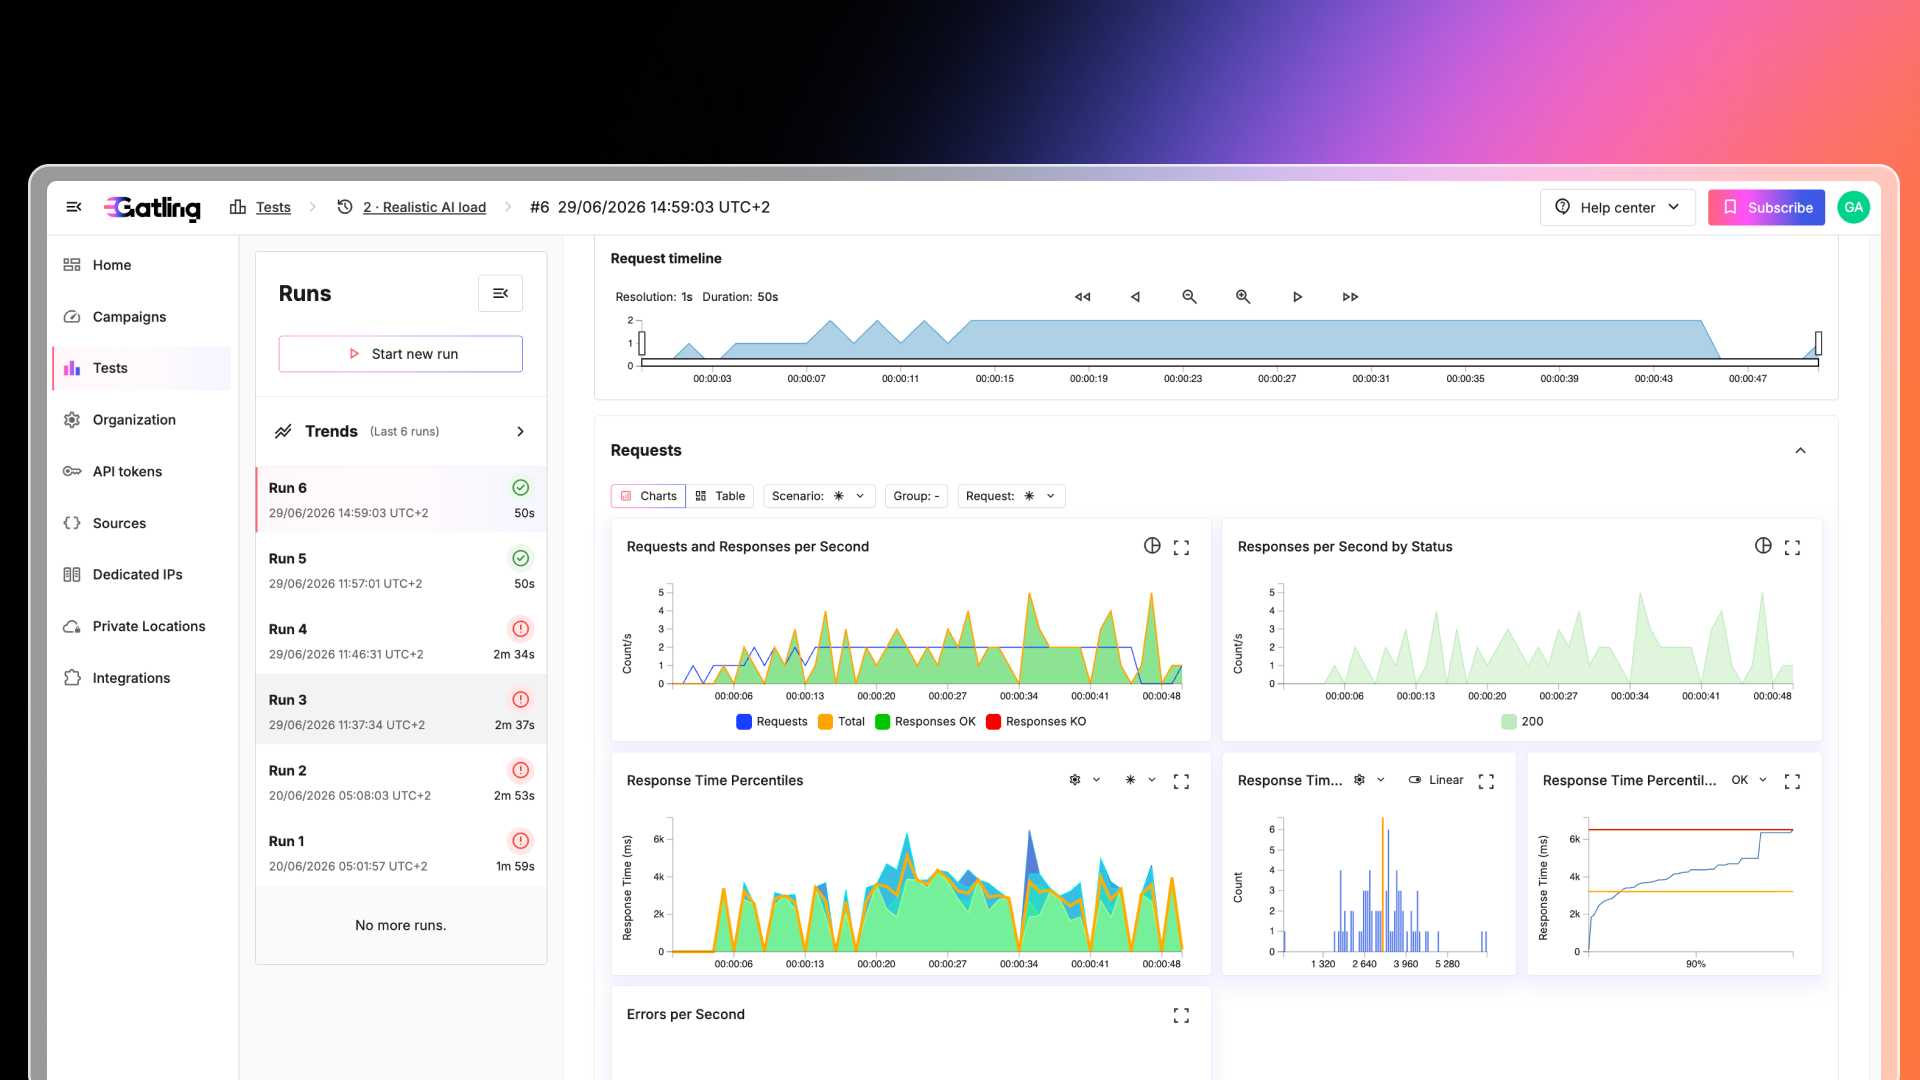
Live Session
Build, run, and interpret your first load test. A practical session: by the end, you'll know exactly what Enterprise gives you out of the box.
Loading next session...
30 minutes
Live + Q&A

Teams run a test, get a p95 of 340 ms, and then debate whether that's good. The test did its job, but nobody defined what passing looked like.
A Service Level Objective (SLO) closes that gap. It's a performance contract: a target your system must meet, evaluated continuously, with a clear verdict on every run. And the cost of leaving it undefined is no longer abstract.
Cost of a single hour of downtime for more than 90% of mid-size and large enterprises
ITIC, 2024Of enterprises put the cost of one hour of downtime between $1 million and $5 million
ITIC, 2024Why load tests without SLOs leave value on the table, and the anatomy of an SLO: metric, threshold, compliance.
Which metrics to track and which to ignore, plus industry benchmarks to put your targets in context.
How to put SLOs to work: use error budgets to govern releases, and turn every load test into a decision, not a debate.
Who it's for: engineering managers accountable for performance standards, platform and SRE teams standardizing targets across services, and development teams who want an unambiguous answer at the end of every test.
More than half of organizations still don't use SLOs at all. The direction of travel is clear, though, and the question is whether you get there before your next incident does.
Of organizations still use no SLOs today, as SLOs move from early adopter to standard practice
O'Reilly / Google survey, 2025Of SLO users say SLOs help them make better business decisions
O'Reilly / Google survey, 2025Without a threshold, no run can fail, which means no run can meaningfully pass either.
Whether a run was "good" depends on who's looking and what they remember from last time.
Performance degrades gradually. Without a fixed line, each small regression looks acceptable next to the previous one.
When an incident hits production, "did we test for this?" has no defensible answer.
In Gatling Enterprise Edition, every SLO comes down to three parameters.
A response time percentile (p50, p95, p99, up to p99.9999) or the error ratio across all scenarios.
Milliseconds for response time, a percentage for error ratio.
The percentage of seconds during the run where the condition held.
Compliance is what separates an SLO from a plain assertion. A pass/fail tells you whether the run ever crossed the line. A compliance score tells you how long you stayed on the right side of it. If your p99 held under 400 ms for 94% of the run, you know that number, and you know there's a 6% to look at.
Results show up in the run summary as color-coded gauges:
The target held 99% of the time or more. The system held the line.
Between 90% and 99%. Close enough to be worth a look.
Under 90%. The SLO was breached.
SLOs are configured entirely in the platform, so engineering managers and platform teams can define and adjust thresholds without depending on the developer who wrote the test.
Three metrics cover the vast majority of performance SLO needs.
It captures the experience of your slowest 5% of requests: representative of real degradation without being dominated by outliers.
p50 hides tail behavior entirely. Half your users could be having a bad experience and the median wouldn't move.
A service can pass p95 while a predictable 1% of sessions time out. On revenue-critical paths, that 1% matters.
One nuance: hold p99 to 95% compliance rather than 99%. Tail latency is naturally noisier, and 99% produces false failures on healthy runs.
The most overlooked of the three. Almost every team tracks availability, fewer track latency percentiles, and almost none set an error ratio target.
Yet it catches the "available but failing" state that availability monitoring misses.
Google's Gmail team raised measured availability from 99.0% to over 99.9% without changing the service, by measuring at the client instead of the server. The server-side numbers had looked fine all along.
Where you measure matters as much as what you measure.
Industry benchmarks are context, not prescription. Your SLO should reflect three things about your specific service.
Authentication needs to respond in about 150 ms: it's a gate, and users have no patience for slow logins. A background pipeline can take 2 seconds, because what matters is time to completion, not acknowledgement.
Expectations vary by an order of magnitude across service types, so a single standard gives thresholds that are either dangerously loose or impossibly tight.
A 5% p95 breach at 100 requests per minute affects 5 users. At 10,000 requests per minute, it affects 500, every minute.
High-volume services warrant tighter thresholds; low-traffic internal tools can afford looser ones.
If you have contractual SLAs, your internal SLO needs a safety buffer below the external commitment. Operate exactly at the SLA line and you will breach it.
If users tolerate some latency, give your team headroom instead.
Chat with Aim, our AI assistant, about your SLOs. Tell it your industry, service type, traffic, and stakes, and it suggests p95, p99, and error ratio targets with the reasoning behind each.
Typical targets by industry, drawn from regulatory guidance, published standards, and industry studies. Use them as a starting point for your own thresholds.
| Industry | Availability | p95 | Error rate |
|---|---|---|---|
| Fintech and payments | 99.999% | <200 ms | <0.005% |
| E-commerce and retail | 99.95% | <300 ms | <0.1% |
| SaaS and enterprise | 99.9% | <500 ms | <0.1% |
| Media and streaming | 99.95% | <500 ms | <0.2% |
| Healthcare | 99.99% | <300 ms | <0.01% |
Of businesses now require at least 99.99% availability: just 52.6 minutes of downtime a year
ITIC, 2024Target five nines, which allows only 5.26 minutes of downtime a year
ITIC, 2024Is no longer aspirational. It's the baseline expectation for serious production systems
Use error budgets to govern releases: an error budget isn't an abstraction, it's a spending account.
Setting targets is one thing; using them to run an engineering organization is another. Every SLO creates an error budget: the unreliability you can absorb before reliability work takes priority. A 99.95% target on 10 million monthly requests allows 5,000 bad events, and every one has a price.
Average cost of unplanned downtime per minute
EMA Research, 2024Per minute for large enterprises specifically
EMA Research, 2024Bad events allowed per month at 99.95% on 10 million requests
| Budget state | Action |
|---|---|
| Healthy | Normal releases |
| 50% consumed | Increase monitoring, reduce risky deploys |
| 80% consumed | Require approval for critical-path changes |
| Exhausted | Freeze non-critical releases |
Track a customer-facing SLO alongside an internal one. It shows where failures originate, and stops "the provider was down" from masking your own gaps.
Monitoring tells you what happened. Load testing tells you what will happen under pressure. An SLO that has never been validated against peak traffic is a hypothesis, not a commitment.
The complete SLO loop turns performance from a debate into a measurement.
Choose p95, p99, and error ratio targets suited to your service. Not sure where to start? Ask Aim, our AI assistant, for a defensible first number.
Set them in Gatling Enterprise Edition without code. Stack as many SLOs per test as you need.
Every load test evaluates every SLO continuously, second by second.
Compliance gauges give an instant verdict: green held the line, orange needs a look, red breached.
Burn rate informs release decisions; failed compliance points to exactly where to investigate.
Adjust thresholds as your system and your standards evolve.
Teams that treat load test results as data to interpret will keep debating whether 340 ms is good. Teams that define SLOs get a verdict on every run, catch regressions while they're still small, and can show exactly how long their systems held the line.
Start with three metrics, set thresholds that fit your service, validate them under peak load, and let error budgets decide when to ship.
Every load test should end with an answer. SLOs give you one.
Take the full guide to your next planning session, or see SLOs and compliance scoring working in a live session.
The anatomy of an SLO, the three metrics that matter, industry benchmarks, and error budget rules.
PDF · free, no form Download the PDF downloadA guided walkthrough with a Gatling engineer, with time for your questions.
Join the next live session arrow_forward