Self-Hosted
Compare test results.
Run / Trends
Runs list and trends can be accessed by clicking on the icon in the simulations table.
This view contains the list of your simulation’s runs which can be filtered by name and/or status and the Trends which are displaying information between those runs.
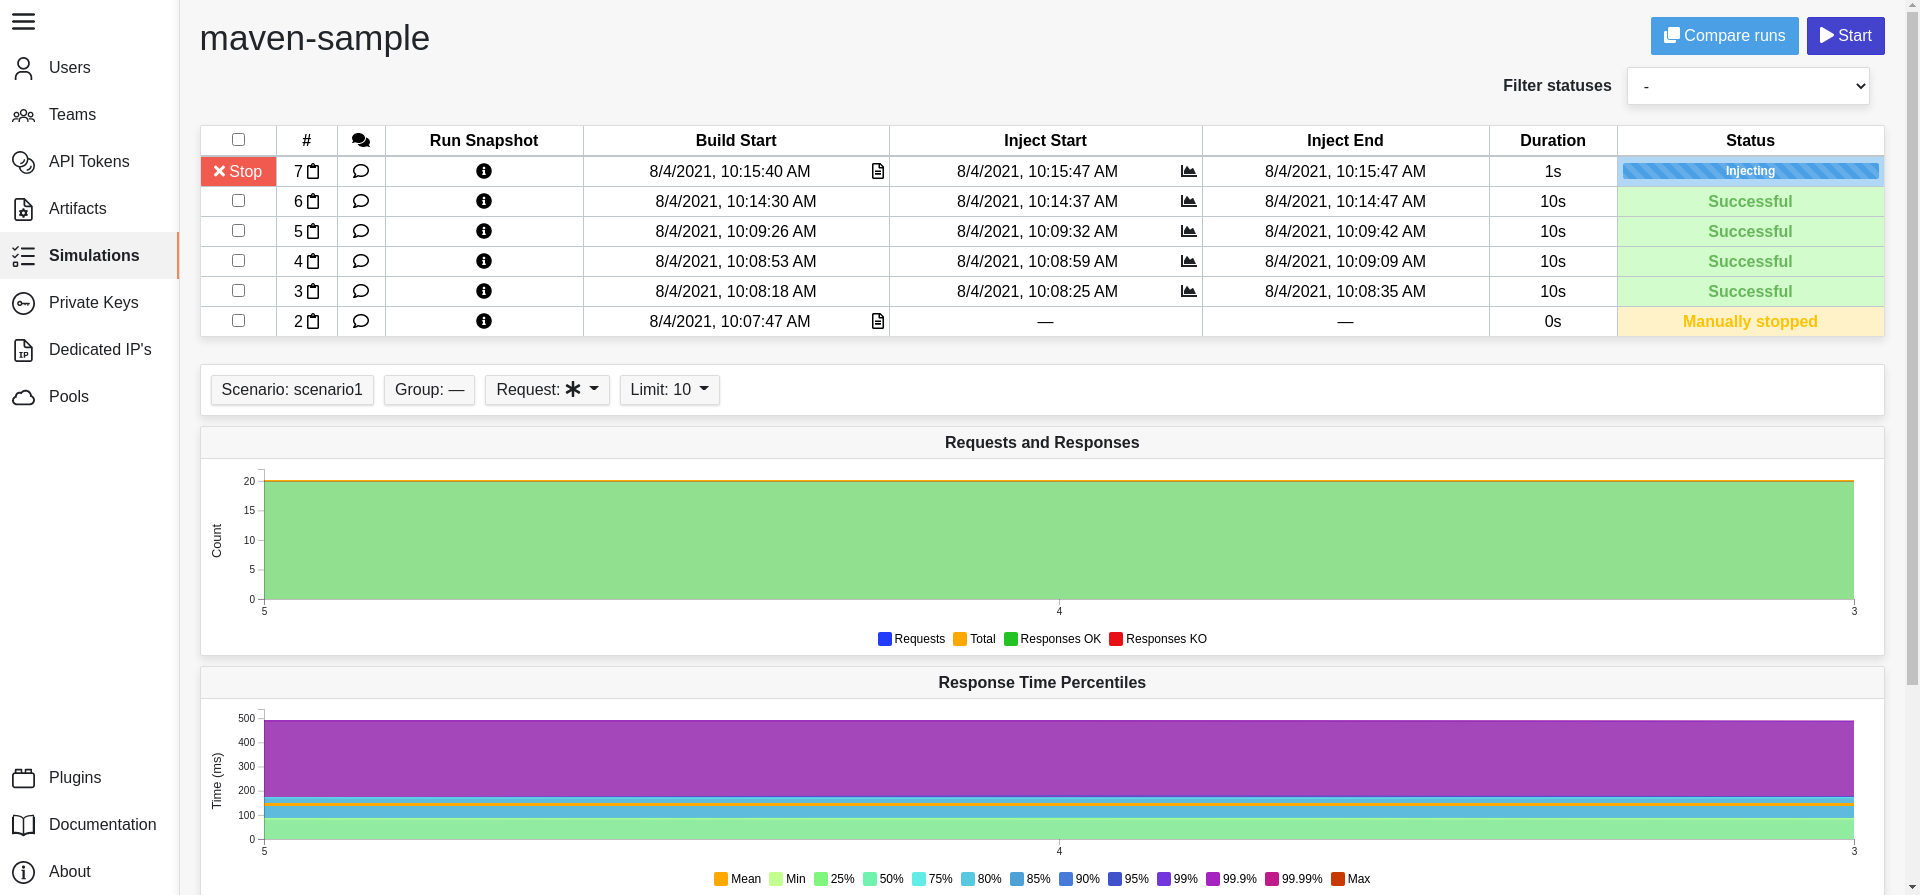
Runs table
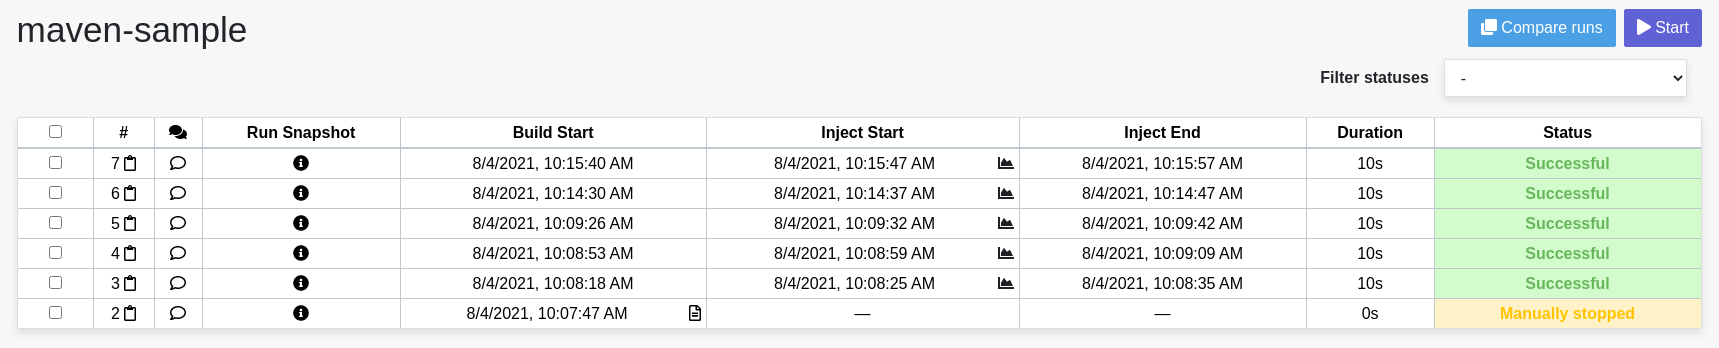
Like the result of the latest run in the simulations table you have access to the logs of the run by clicking on the icon and you can sort the table by each columns. The logs are only available for run which are not flagged as “Successful”.
If there is one, You can click on the icon next to the status to display the assertions of the run. You can delete runs by selecting them and click on the Delete button in the action bar above the table.
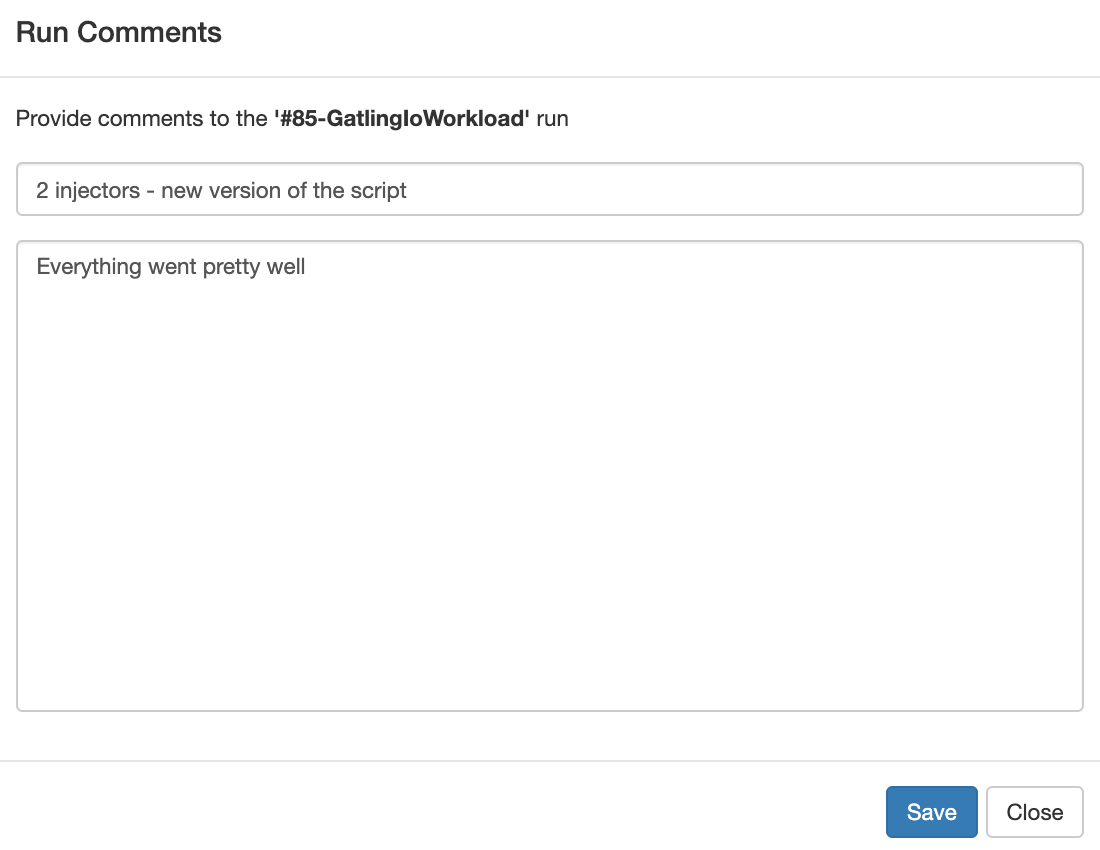
You can comment a run by clicking on the icon on the right side of the table.
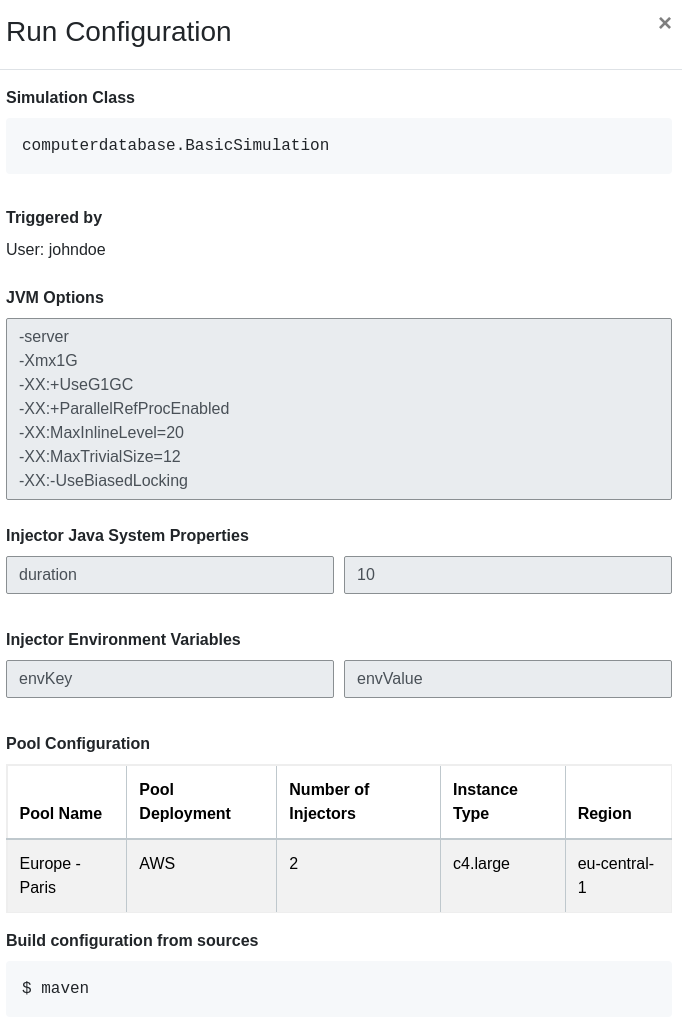
You can also click on the
icon to see a snapshot of the run configuration. The Java System Properties beginning with sensitive. and environment variables beginning with SENSITIVE_ are not displayed.
Run Comparison
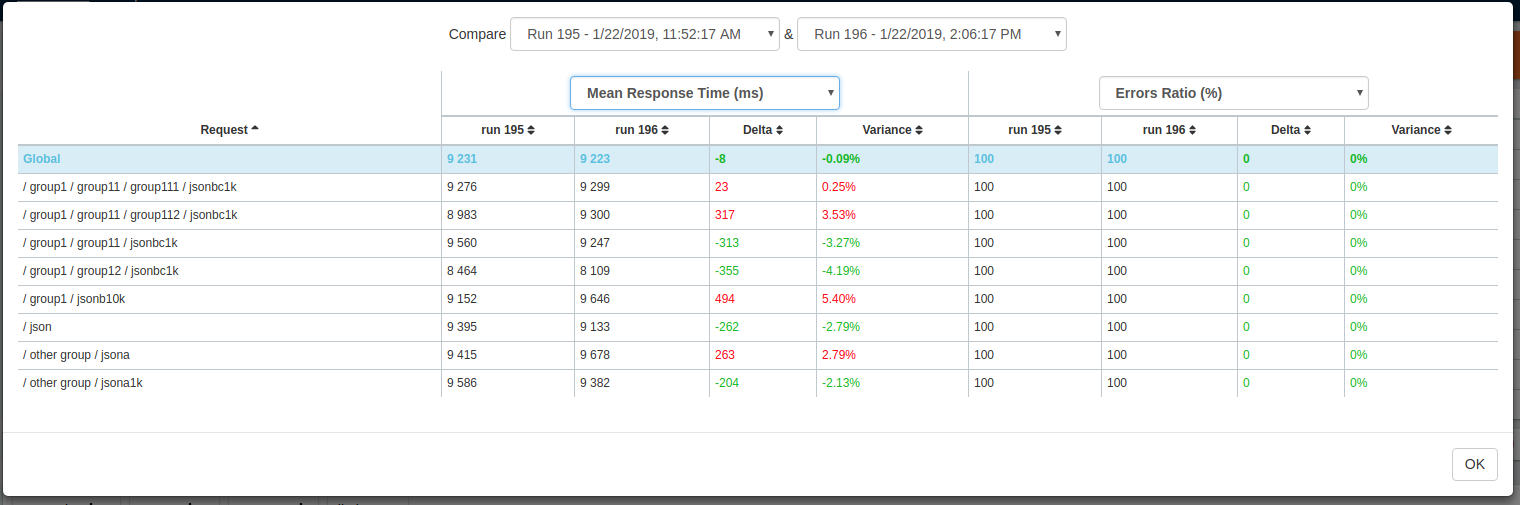
You can compare the results of two runs if you click on the “Compare runs” button in the table. It allows you to compare the response time and errors of the two runs for each request.
You can choose the specific metric you want to compare by clicking on the metric name, and the specific run you want to compare by clicking on the run number.
The delta and variance will be displayed, so you can check if there is a progression or a degradation in performance.
Trends charts
The trends are charts that will display some globals statistics for each runs (eg: requests count) so that you can easily see how well your runs went compared to each other. Each run is represented by his number in the chart and the chart won’t display the statistics of a failed run (eg: Timeout, broken, etc.).
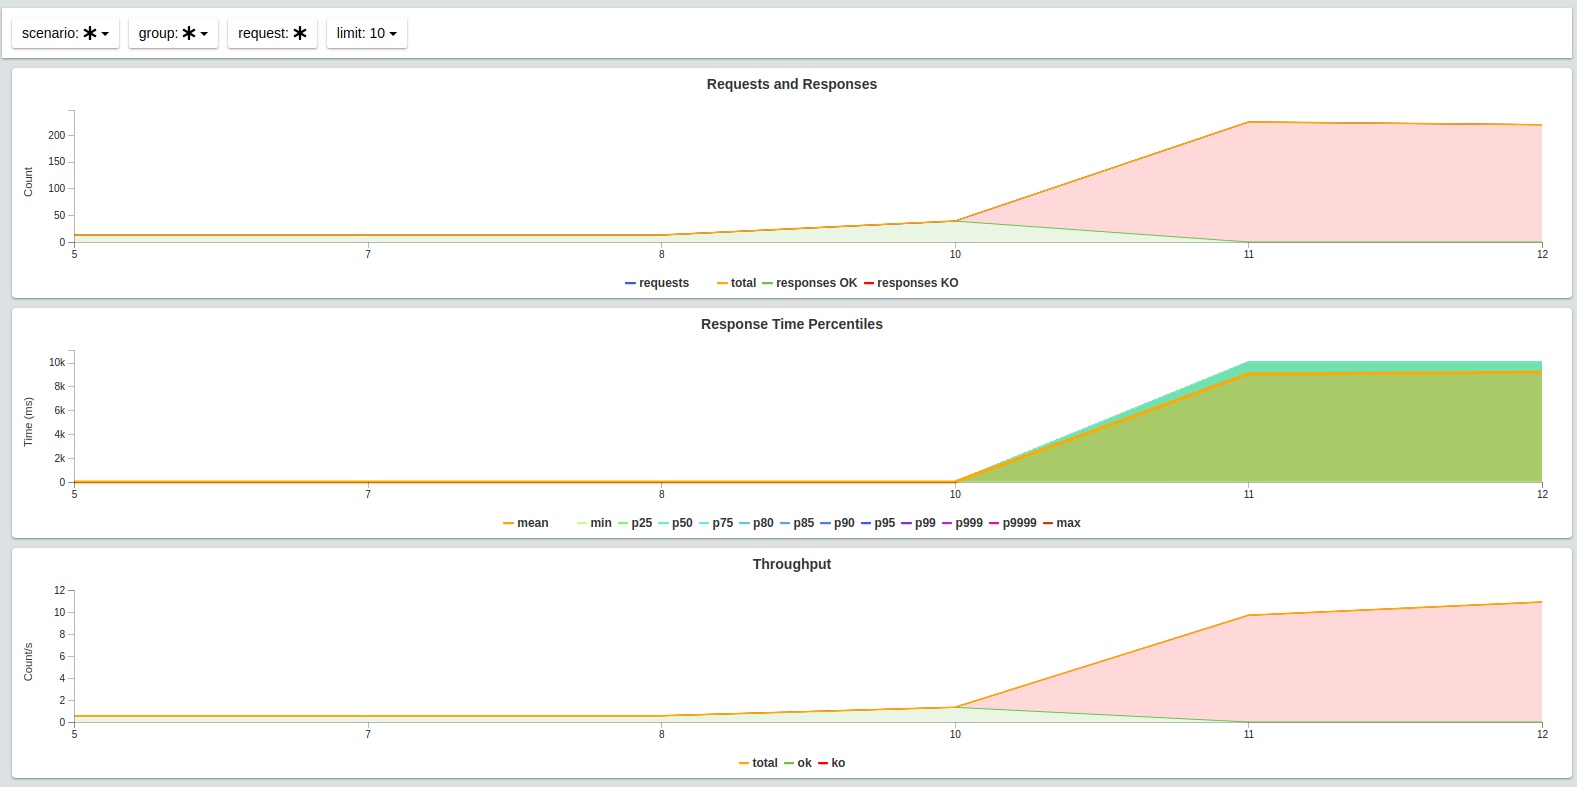
You can filter the statistics shown by filtering through scenarios, groups or requests that are involved in each run. You can choose how many runs will be compared by changing the limit (10, 25, 50, 100):
